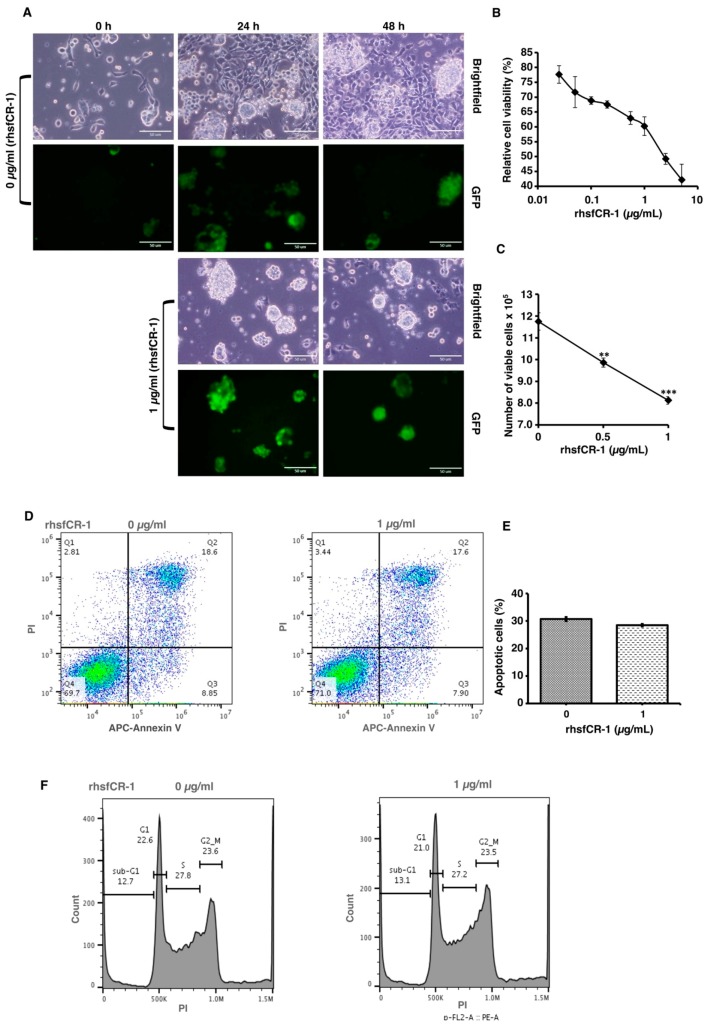
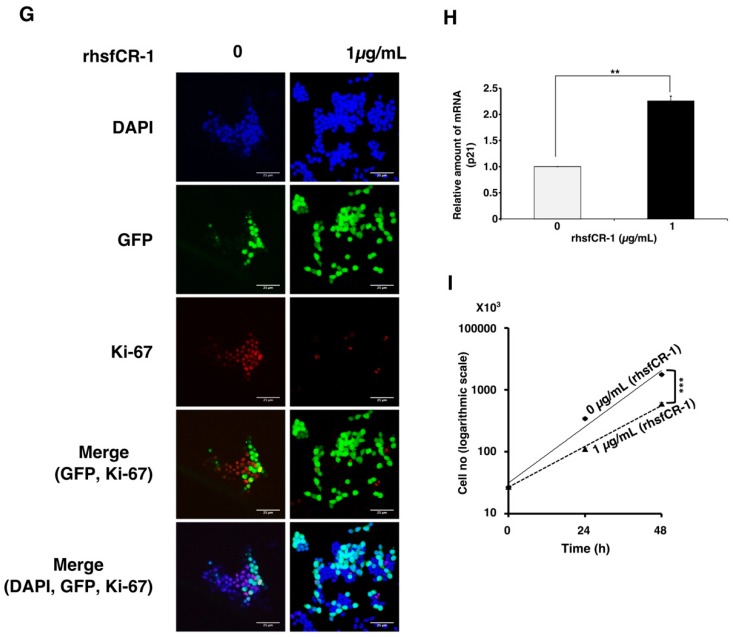
Figure 2.
Evaluation of the suppression of growth in miPS-LLCcm cells by rhsfCR-1. (A) miPS-LLCcm cells were treated for 48 h with/without rhsfCR-1 (1 µg/mL) and photographed under adherent condition; (B) miPS-LLCcm viability were assessed by MTT assay after 24 h treatment with different concentrations of rhsfCR-1. Experiments were repeated three times and the data were plotted as the mean ± SD (n = 3); (C) live cells were counted after 24 h treatment with either 0.5 µg/mL and 1 µg/mL rhsfCR-1; (D) rhsfCR-1 did not induce apoptosis of miPS-LLCcm cells. Apoptosis was assessed after 24 h of treatment with rhsfCR-1 by flow cytometry with double staining with PI and APC-Annexin-V; (E) no significant changes in the number of apoptotic cells were found between the treatments with/without rhsfCR-1. Bar plots represent the percentage of apoptotic cells in (D); (F) rhsfCR-1 did not affect on the cell cycle of miPS-LLC cells. Cells treated with/without rhsfCR-1 were stained with PI and analyzed by flow cytometry; (G) confocal observation of immunostaining of miPS-LLCcm cells with anti-Ki-67 antibody together with GFP and DAPI staining; (H) rt-qPCR analysis of p21 expression in miPS-LLCcm cells treated with/without rhsfCR-1; (I) rhsfCR-1 suppressed the growth of the miPS-LLCcm cells during the time course up to 48 h. Live cells were counted after 24 and 48 h treatments with/without rhsfCR-1. Each bar represents mean ± SD from three independent plates. One-way ANOVA with pairwise multiple comparisons (C), Student’s t-test (H) and Two-way ANOVA (I) were used to analyze the level of significance (** p < 0.01, *** p < 0.001).


