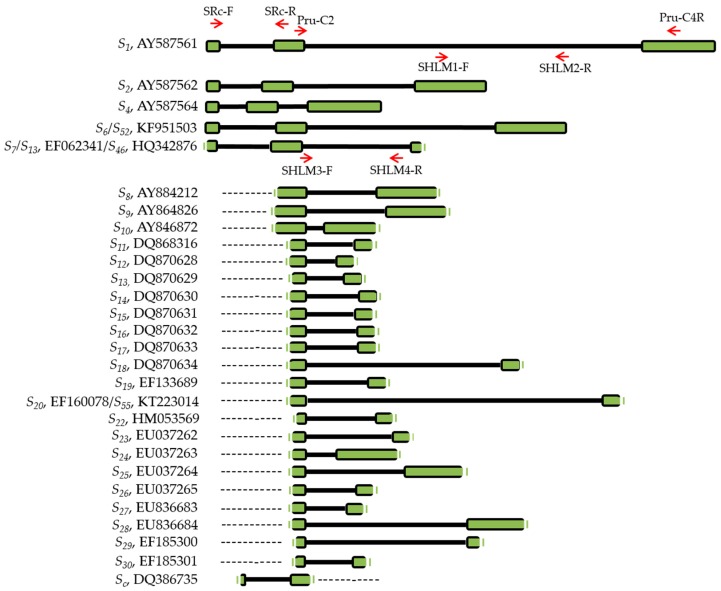
Figure 1.
Gene structure of the S-alleles sequenced, showing the exons in green square and including the primers used in this study for the alleles S1 and S7/S13/S46. Unknown sequences are represented by dotted lines. The first column shows S-genotype and gen bank accession. S1 [41], S2 [41], S3 [41], S4 [41], S6/S52, S7/S13 and S46 [Unpublished], S8 [42,43], S9 [42], S10 [42], S11 [34], S12 [34], S13 [34], S14 [34], S15 [34], S16 [34], S17 [34], S18 [34], S19 [34], S20 [34]/S55 [Unpublished], S22 [44], S23 [44], S24 [44], S25 [44], S26 [44], S27 [44], S28 [44], S29 [44], S30 [44], Sc [43].

