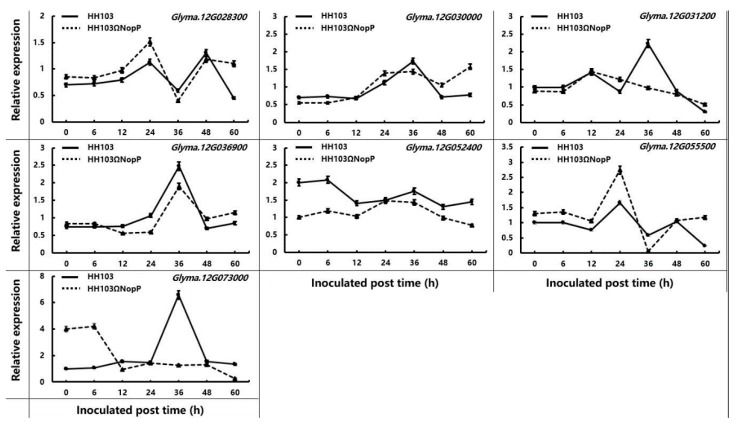
Figure 4.
Relative expression levels of Glyma.12g028300, Glyma.12g030000, Glyma.12g031200, Glyma.12g036900, Glyma.12g052400, Glyma.12g055500 and Glyma.12g073000 in soybean roots after being independently inoculated with Ensifer fredii HH103 and Ensifer fredii HH103ΩNopP in ‘Charleston’, and non-inoculated plants as the control. The expression levels of target genes relative to the control samples at corresponding time points were calculated using the 2−ΔΔCt method. Bars represent the mean ± SE (standard error) of three replications. Different letters represent significant differences (p ≤ 0.05) at each time point based on Duncan’s multiple range test.

