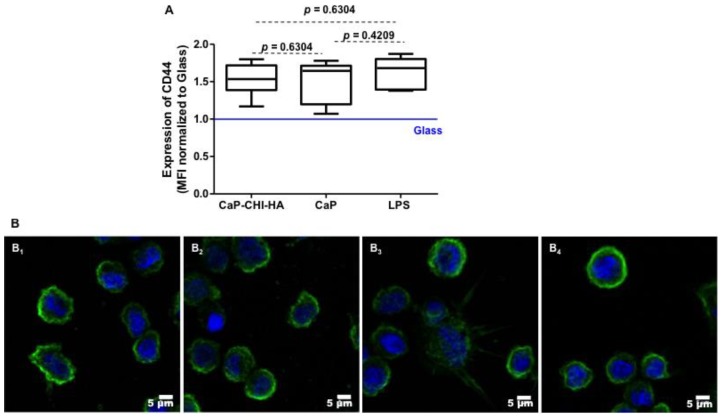
Figure 4.
CD44 expression. Median fluorescence intensity normalized to glass, obtained by flow cytometry (n = 6, Mann Whitney statistical test) (A) and confocal laser scanning microscopy views of CD44 labelled receptors (B) expressed by THP-1 in contact with CaP-CHI-HA (B1), CaP (B2); stimulated with LPS (B3) and on glass (B4) showing clustered and functional receptors at the membrane whatever the studied condition. Green color corresponds to CD44 and blue to nuclei (scale bars indicate 5 μm).

