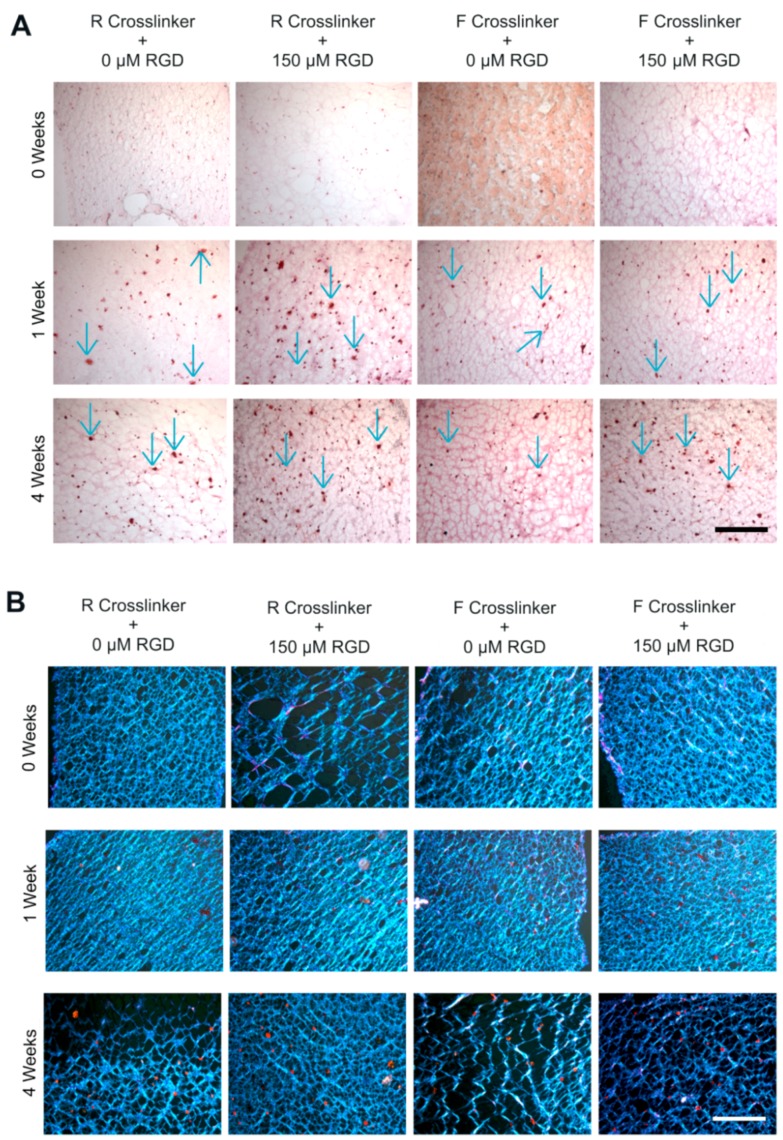
Figure 9.
Representative images of histological staining of ATDC5 cells encapsulated in 6.5% (w/v) PEG hydrogels. (A) Brightfield images of safranin-O stained sections for visualizing GAG deposition. Positive staining is demarcated via blue arrows. (B) Polarized light images of picrosirius red stained sections demonstrating collagen production. Collagen is displayed orange under polarized light. All images taken with 10× objective on a Leica microscope. (Scale bar = 100 µm).

