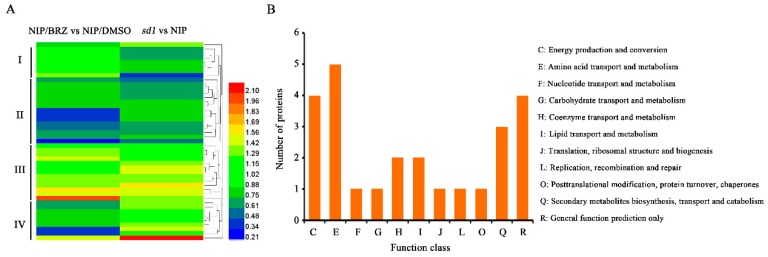
Figure 4.
Hierarchical cluster analysis and Clusters of Orthologous Groups (COG) classification of differentially abundant proteins in the embryos of BRZ-treated NIP and the sd1 mutant. (A) Hierarchical cluster analysis of common proteins in response to both BRZ treatment and OsGA20ox2 mutation. (B) COG classification of all common proteins.

