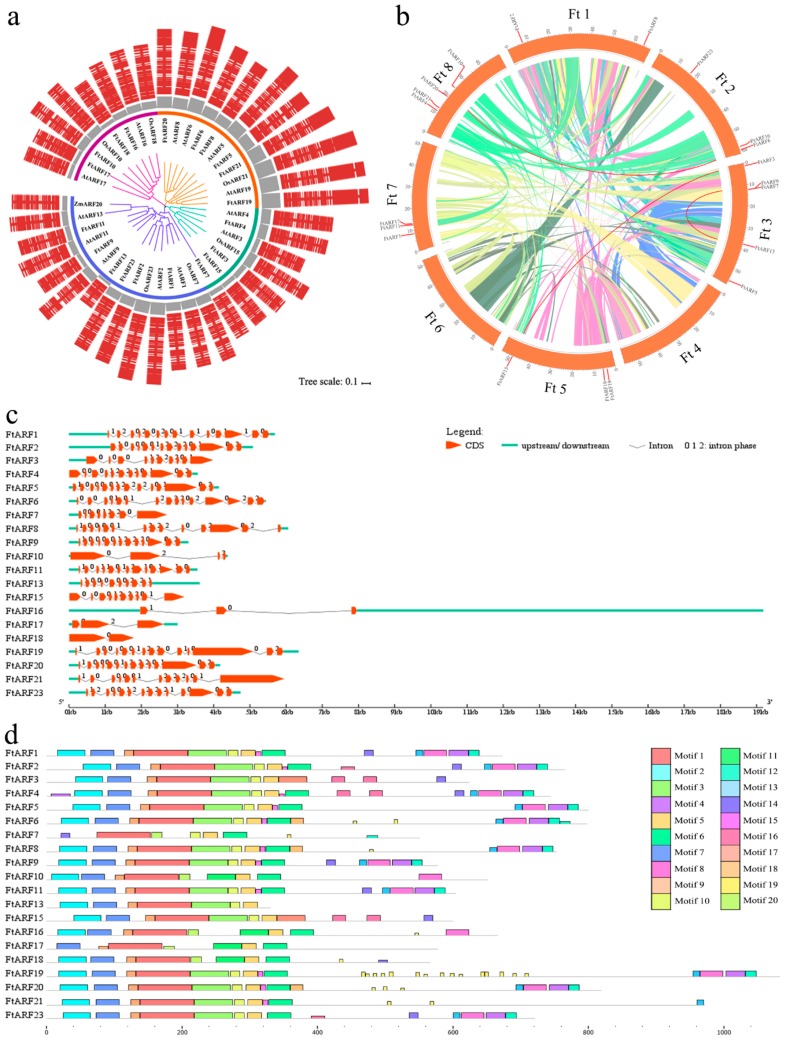
Figure 1.
ARF gene family in tartary buckwheat. (a) Unrooted phylogenetic tree representing relationships among the FtARFs. The different-colored arcs indicate different groups. Gray columns represent protein lengths. Red columns represent protein sequence structure. (b) Schematic representations of the chromosomal distribution and interchromosomal relationships of the FtARF genes. Colorized lines indicate all synteny blocks in the tartary buckwheat genome, and the red lines indicate duplicated ARF gene pairs. The chromosome number is indicated at the bottom of each chromosome. (c) Exon–intron structure of FtARF genes. Orange boxes indicate exons; green lines indicate introns. The number indicates the intron phase. (d) The motif composition of FtARF proteins. The motifs, numbered 1–20, are displayed in different-colored boxes. The sequence information for each motif is provided in Table S2. The length of protein can be estimated using the scale at the bottom.

