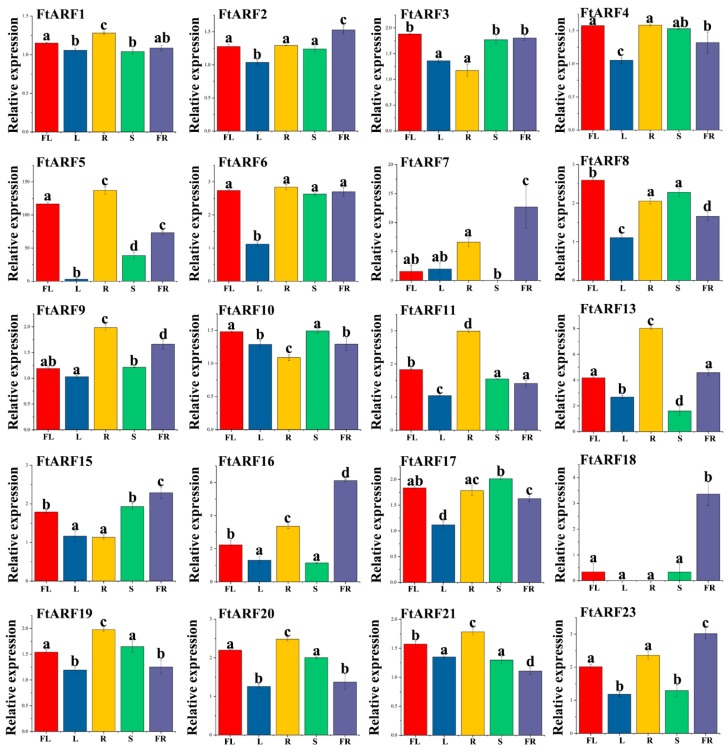
Figure 4.
Expression profiles of 20 FtARF genes. The expression patterns of 20 FtARF genes in flower (FL), leaf (L), root (R), stem (S), and fruit (FR) tissues were examined by a qPCR assay. Error bars were obtained from three measurements. Small letter(s) above the bars indicate significant differences (α = 0.05, LSD) among the treatments.

