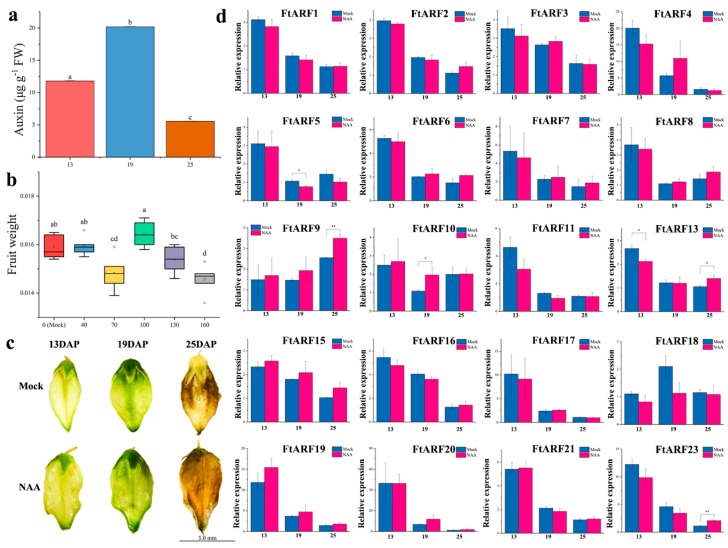
Figure 6.
Fruit development of tartary buckwheat under exogenous auxin treatment. (a) IAA content during fruit development. (b) Final weight of the fruits treated with different concentrations of exogenous auxin. x-axis: weight of mature fruit, y-axis: concentration of naphthalene acetic acid treatment. (c) Pictures of the fruits treated with exogenous auxin during fruit development. (d) Differences in the expression of 20 FtARF genes under exogenous auxin treatment during fruit development. Mock: the same amount of water treatment, NAA: 100 mg·L−1 naphthalene acetic acid treatment. Error bars were obtained from three measurements. Small letter(s) above the bars indicate significant differences (α = 0.05, LSD) among the treatments. * and ** indicate significant correlation at 0.05 and 0.01 levels, respectively.

