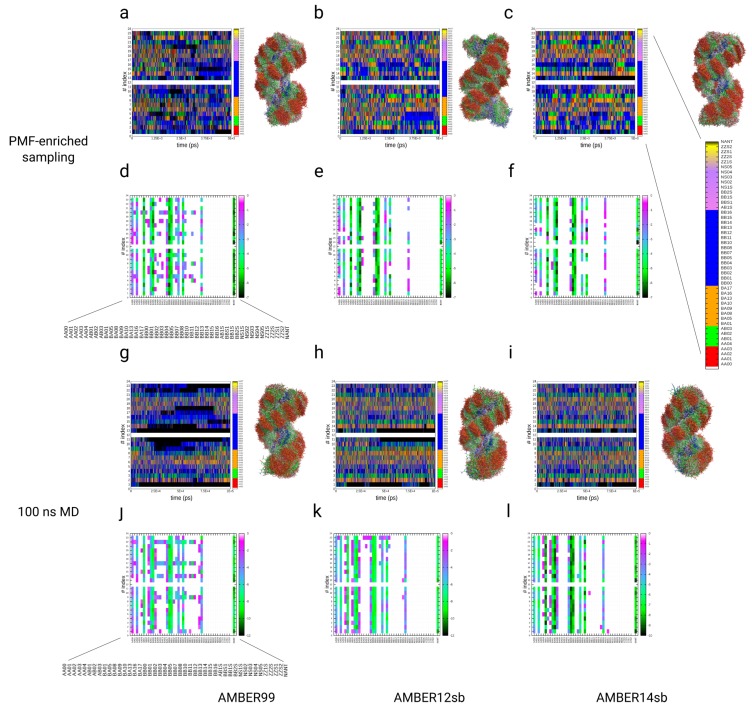
Figure 5.
Results from the nucleotide conformer (NtC) assignment analysis of three PMF-enriched simulations of the Dickerson–Drew DNA dodecamer (with the coupling parameter ) (a–f) (see Methods section). The overlaid structures of each trajectory are displayed on the right side of the panels (a–c) and (g–i). We compare the data with 100 ns MD simulations of the same systems with identical force field parameter sets (g–l). (a–c,g–i) NtCs as a function of time from the simulation using different conventional force fields (): AMBER99 (a,d,g,j), AMBER12sb (b,e,h,k), and AMBER14sb (c,f,i,l). (d–f, j–l) Free energy partition () as a function of the conformer class index and the step-index along the DNA sequence from the simulations. The colored bar expresses the energies in units of .

