Figure 7.
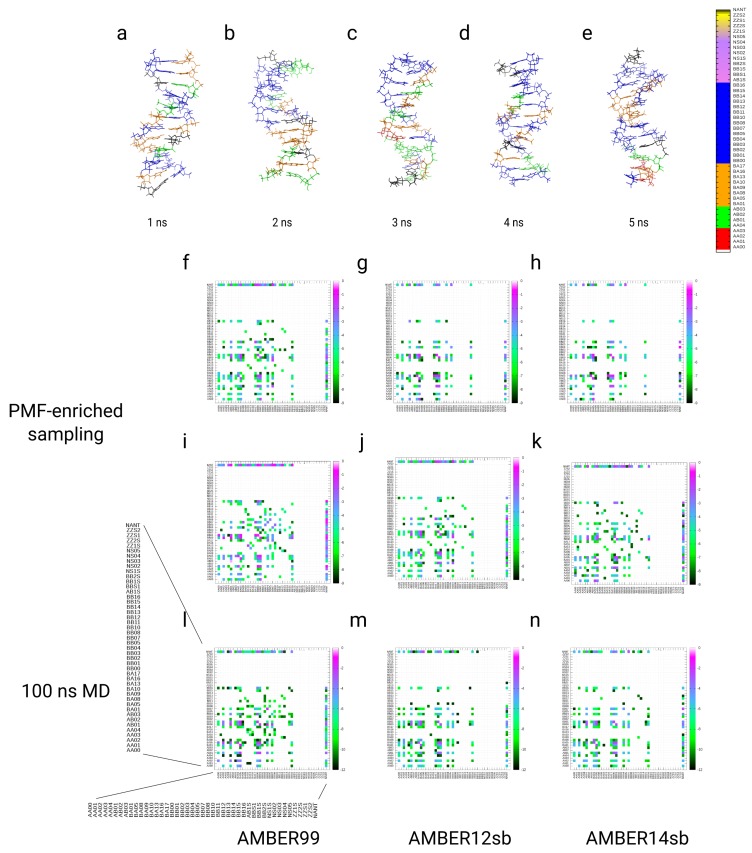
(a–e) Conformers of the Dickerson–Drew DNA dodecamer along the enhanced sampling trajectory over 5 ns using the AMBER12sb force field (with a coupling factor ). Conformers are color-indexed depending on their assignment to the 44 different NtC classes from the structural alphabet. The colored bar represents the structural classes shown on the right side. (f–k) Results from the kinetic analysis of the frequencies , of the transition time between different structural classes (in the order from class n shown on the x-axis to classes n’ on the y-axis) as a function of 44 different NtC classes in the PMF-enriched (f–k) and 100 ns MD simulations (l–n) (class #45 represents the non-assigned class)) (using the two different coupling factors: (f–h) and (i–k)). We compared the three simulations with different force fields: AMBER99 (f,i,l), AMBER12sb (g,j,m), and AMBER14sb (h,k,n).

