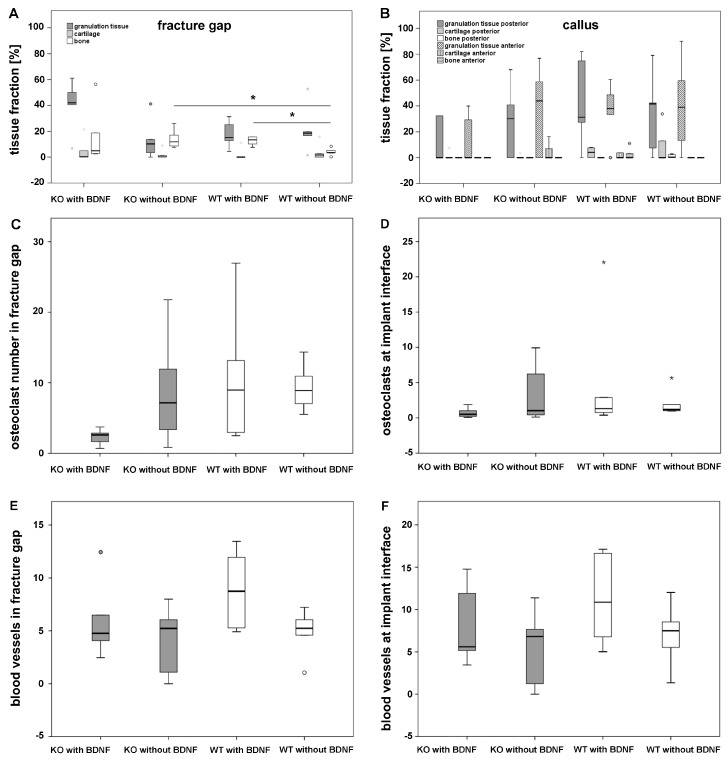
Figure 4.
Histomorphometrical analysis: fraction of granulation tissue, cartilage and bone in fracture gap (A) and in callus, the dotted line represents boxplots indicating a value of zero (B), osteoclast numbers within the fracture gap (C) and at implant interface (D), number of blood vessels in fracture gap (E) and at implant interface (F). The grey and white circles indicate outliers. The grey * indicate extreme outliers. The black * illustrate statistically significant differences with a likelihood of p ≤ 0.05.

