Figure 2.
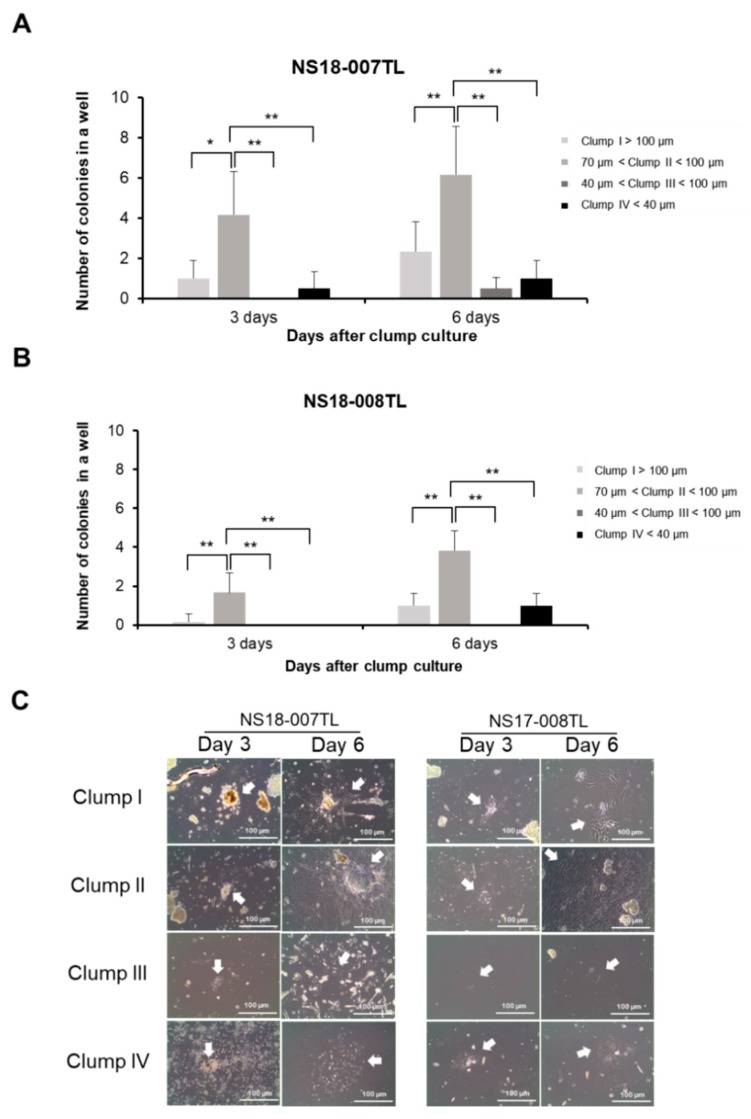
Colony forming efficiency of clumps. Adherent colonies from each clump-type were counted and photographed at 3 days and 6 days after in vitro culture ((A,B) respectively, n = 5 for each group). The number of adherent colonies from each clump-type was compared to each other ((A) for NS18-007TL and (B) for NS18-008TL). Height = average, error bar = standard deviation. * p < 0.05, ** p < 0.01. (C) Morphologies of adherent colonies are illustrated. Colonies are indicated by white arrows. Scale bar = 100 μm.

