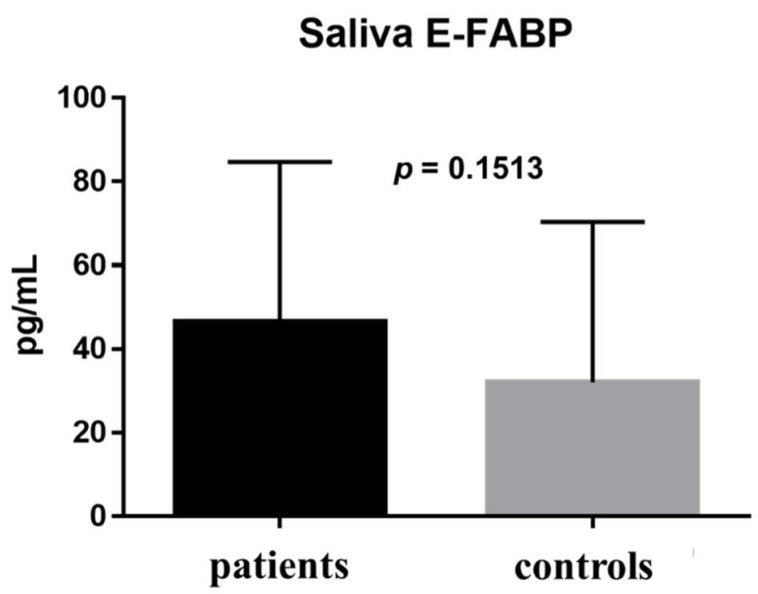
Figure 2.
Saliva E-FABP concentrations. The E-FABP concentration in the saliva was 46.46 ± 38.22 pg/mL (range: 8.527–130.6 pg/mL; median: 40.44 pg/mL) in the patient group (n = 9) and 32.08 ± 38.31 pg/mL (range: 6.1–107.3 pg/mL; median: 20.38 pg/mL) in the control group (n = 12); the difference between the groups was not statistically significant (p = 0.1513). Data are expressed as the mean with SD (one bar per column).

