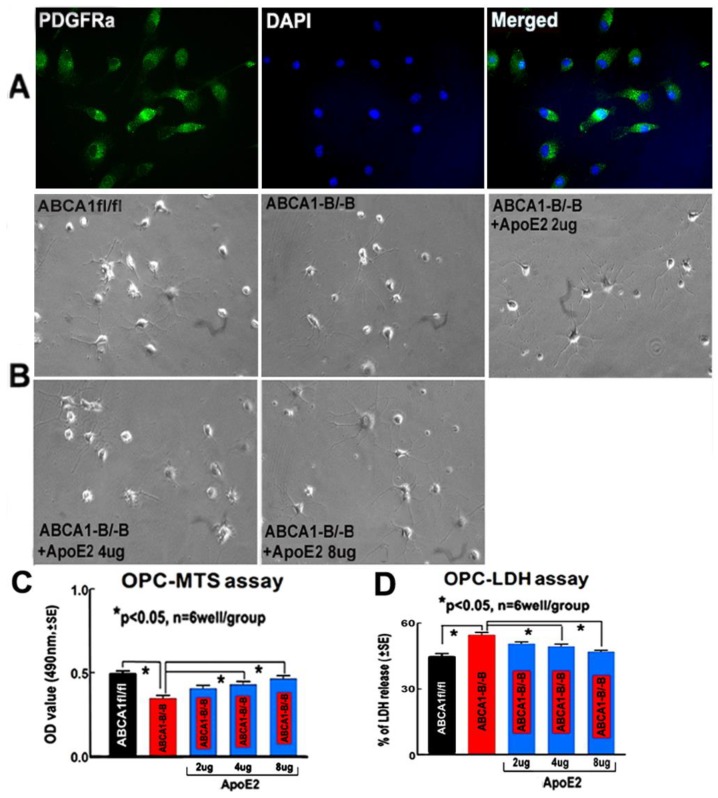
Figure 8.
ApoE2 treatment increased OPC proliferation/survival. (A) The OPC images immunofluorescent-stained with platelet-derived growth factor receptor alpha (PDGFRa, a marker of OPCs) (green), O4 (red), DAPI (blue), and merged; (B) the light images of OPCs and treatment with different doses of ApoE2; (C) 3-[4,5-dimethylthiazol-2-yl]-5-[3-carboxymethoxyphenyl]-2-[4-sulfophenyl]-2H-tetrazolium (MTS) assay; and (D) the lactate dehydrogenase (LDH) assay. * p < 0.05, n = 6 wells/group.

