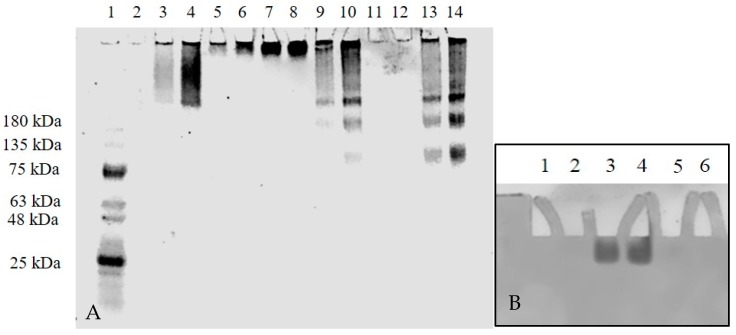
Figure 4.
mAb migration on 4–20% Tris-Glycine PAGE gel under non-reducing conditions followed by Coomassie Blue R-250 stain. The image was taken using a Coomassie Blue filter. (A) Lane 1: molecular marker; Lane 2: purified human IgG 10 µg; Lane 3: bovine gamma globulin 5 µg; Lane 4: bovine gamma globulin 10 µg; Lane 5: T-DM1 5 µg; Lane 6: T-DM1 10 µg; Lane 7: BV 5 µg; Lane 8: BV 10 µg; Lane 9: Se-BV 5 µg; Lane 10: Se-BV 10 µg; Lane 11: TZ 5 µg; Lane 12: TZ 10 µg; Lane 13: Se-TZ 5 µg; Lane 14: Se-TZ 10 µg. (B) TZ migration on 4–20% Tris-Glycine PAGE gel under non-reducing conditions with electrophoretic poles reversed followed by Coomassie Blue R-250 stain. Lane 2: Ladder; Lane 3: TZ 5 µg; Lane 4: TZ 10 µg. (BV: Bevacizumab, Se-BV: Selenobevacizumab, TZ: Trastuzumab, Se-TZ: Selenotrastuzumab).

