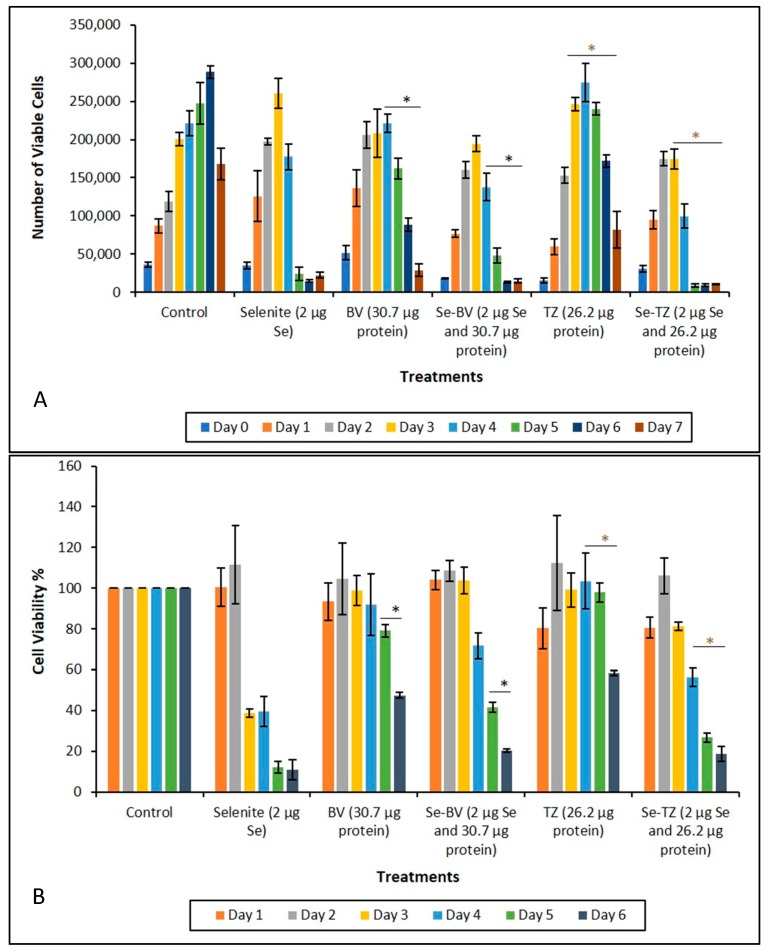
Figure 7.
Analysis of cytotoxicity as a function of percent cell viability during treatment. (A) Cytotoxic effects of control, selenite, BV, Se-BV, TZ and Se-TZ Treatments against MDA-MB-468 cells. Forty-thousand cells were seeded in 48-well-plates and treated (Day 0 of treatment). Viable cells were counted for 7 days and analyzed by Trypan Blue exclusion. The data is expressed as Means ± SE (n = 3). Statistical treatments were compared using two sample t-tests. Treatments were considered statistically significant if p ≤ 0.05 and indicated by * (brown color). (B) Growth inhibition of control, selenite, BV, Se-BV, TZ, or Se-TZ treated MDA-MB-468 cells as determined by MTT assay over 6 days. Forty-thousand cells were seeded in 48-well-plates and treated (Day 0 of treatment). The data is expressed as the Means ± SE (n = 3). Treatments were compared using two sample t-tests. Treatments were considered statistically significant if p ≤ 0.05 (represented by * (black color)). Asterisks indicate significant differences between TZ and Se-TZ (A) and BV and Se-BV (B).

