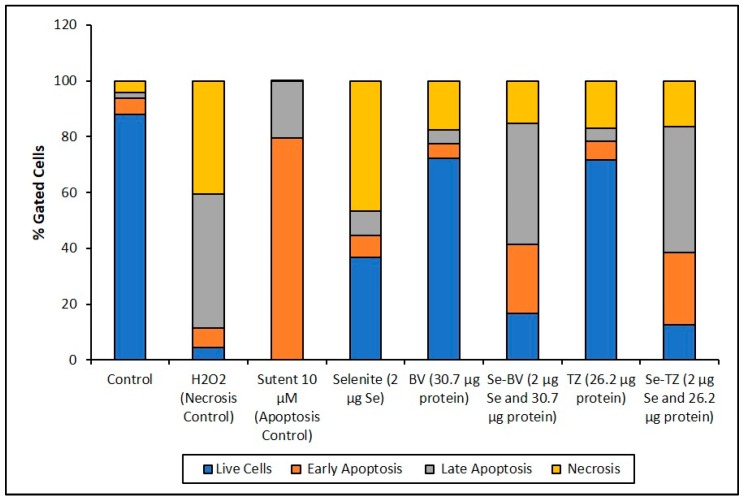
Figure 12.
Cell representation (%) within the four quadrants for MDA-MB-468 cell treatments. Percent distribution of MDA-MB-468 apoptotic cells after treatment with H2O2, Sutent, Selenite as Se, Bevacizumab (BV), Selenobevacizumab (Se-BV), Trastuzumab (TZ), or Selenotrastuzumab (Se-TZ). Data is expressed as the Mean (n = 3).

