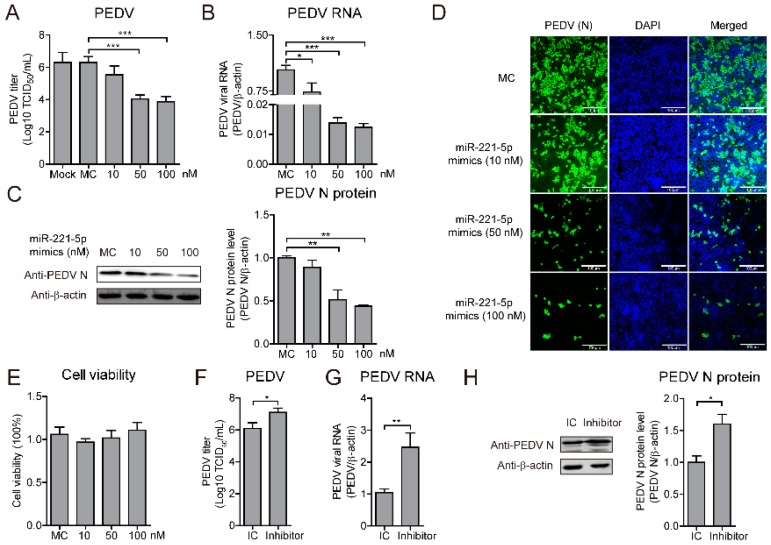
Figure 2.
miR-221-5p inhibits PEDV replication in MARC-145 (African green monkey kidney epithelial cells). (A–E) MARC-145 cells were transfected with miR-221-5p mimics at different concentrations (10, 20, 50, and 100 nM) or mimic control (MC) for 24 h, followed by infection with CH/HBTS/2017 for an additional 24 h. (A) TCID50 analysis of viral titers. Data represent the mean ± SD of three independent experiments and measured in technical triplicate. (B) Real-time qRT-PCR analysis of intracellular virus genomic RNA (normalized to β-actin expression). Data represent the mean ± SD of three independent experiments and measured in technical duplicate. (C) Immunoblot analysis of intracellular PEDV N protein levels. The intensity represents PEDV N protein level (top) normalized to that of β-actin across three independent experiments. (D) Immunofluorescence analysis of intracellular PEDV N protein levels. Scale bar = 100 µm. (E) MTT assay to assess cell viability. Data represent the mean ± SD of three independent experiments and measured in technical triplicate. (F–H) MARC-145 cells were transfected with miR-221-5p inhibitors or IC at 50 nM for 12 h, followed by infection with CH/HBTS/2017 for an additional 36 h. (F) TCID50 analysis of viral titers. Data represent the mean ± SD of three independent experiments and measured in technical triplicate. (G) Real-time qRT-PCR analysis of intracellular viral genomic RNA (normalized to β-actin expression). Data represent the mean ± SD of three independent experiments and measured in technical duplicate. (H) Immunoblot analysis of intracellular PEDV N protein levels. The intensity represents PEDV N protein level (top) normalized to that of β-actin across three independent experiments. Comparisons between groups were determined by Student’s t test. * p < 0.05; ** p < 0.01; *** p < 0.001.

