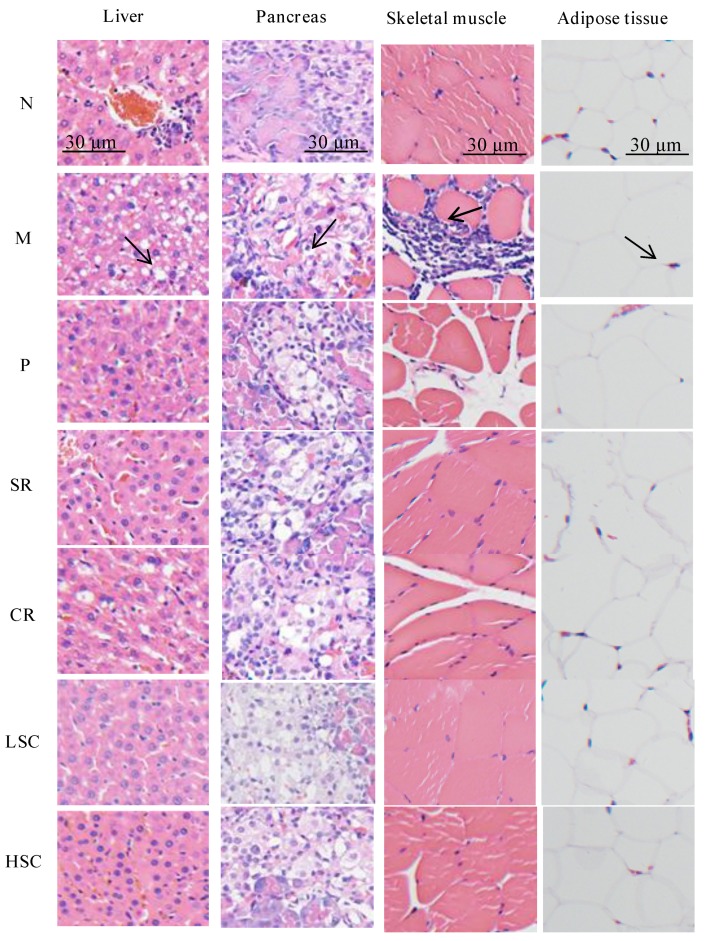
Figure 2.
Histopathological observation of liver, pancreas, skeletal muscle and adipose tissue in the normal group (N), model group (M), and groups gavaged with metformin (P), scutellaria Radix (SR), coptidis Rhizome (CR), low dose of combined extracts group (LSC) and high dose of combined extracts (HSC). Liver tissues of M: notable changes with severe fatty degeneration can been seen as shown by the black arrow; Pancreas of M: severe atrophy of pancreatic islet cells is shown by the black arrow; Skeletal muscle of M: notably inflammatory cells infiltration is indicated by the black arrow; Adipose tissues of M: mean adipocyte diameter was seriously increased, as indicated by the black arrow. Samples were stained with H&E and photographed at 400× magnification.

