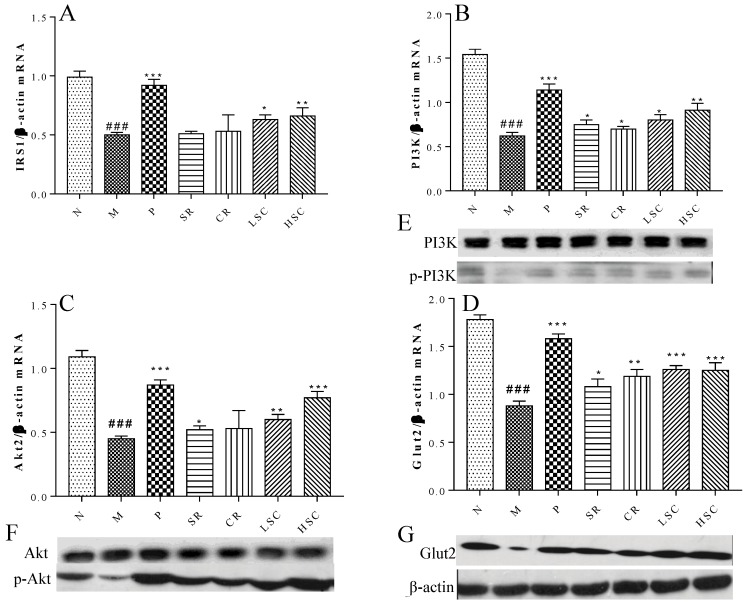
Figure 5.
The effect of metformin (P), scutellaria Radix (SR), coptidis Rhizome (CR), low dose of combined extracts group (LSC) and high dose of combined extracts (HSC) on insulin signaling pathway. (A–D) mRNA expression levels of Insulin receptor substrate 1 (IRS1), Phosphatidylinositol-4,5-bisphosphate 3-kinase (PI3K), Protein kinase B (Akt2) and Glucose transporter 2 (Glut2) in liver of the N, M, P, SR, CR, LSC, and HSC by qPCR; (E–G) Protein expression levels of PI3K, phosphorylated PI3K (p-PI3K), Akt2, phosphorylated Akt2 (p-Akt2), Glut2 in liver of the N, M, P, SR, CR, LSC, and HSC by Western blot. The values are shown as mean ± SD. # p < 0.05, ## p < 0.01, ### p < 0.001 vs. normal group; * p < 0.05, ** p < 0.01, *** p < 0.001 vs. model group. Data were analyzed by One-way-ANOVA.

