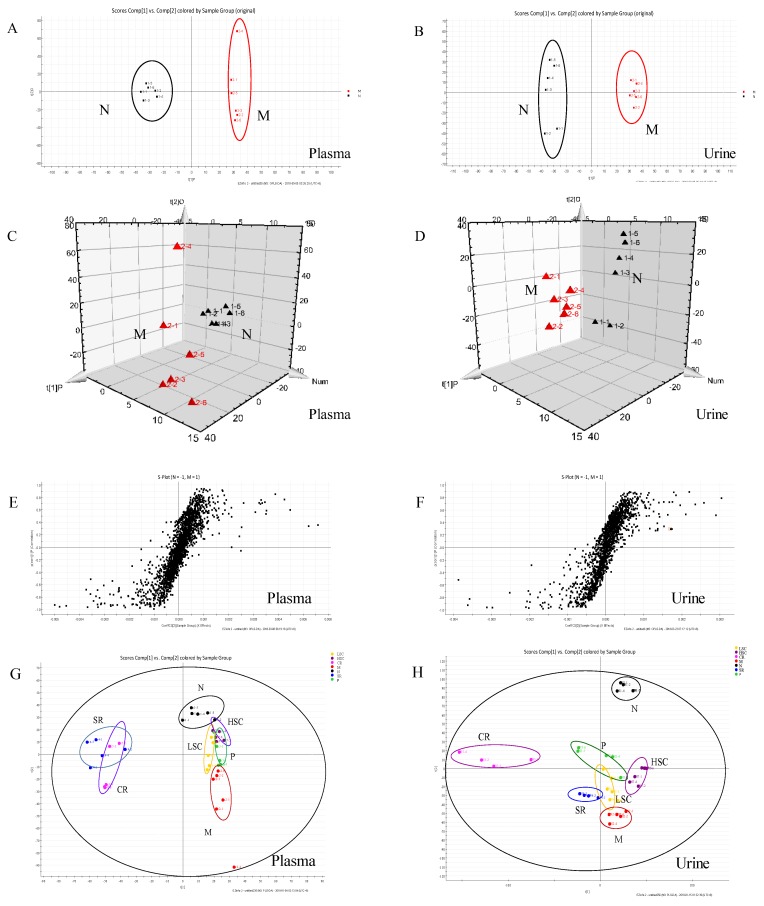
Figure 7.
PCA model results between normal (N) and T2DM (M) rats in negative mode ((A) 2-D plot of plasma; (B) 2-D plot of urine). 3D PLS-DA scores plot of LC–MS spectral data ((C) plasma; (D) urine). S-plot of OPLS-DA model for M vs. N group ((E) plasma; (F) urine). PCA analytical results from N and M rats treated with metformin (P), scutellaria Radix (SR), coptidis Rhizome (CR), low dose of combined extracts group (LSC) and high dose of combined extracts (HSC) at negative mode ((G) plasma; (H) urine).

