Figure 2.
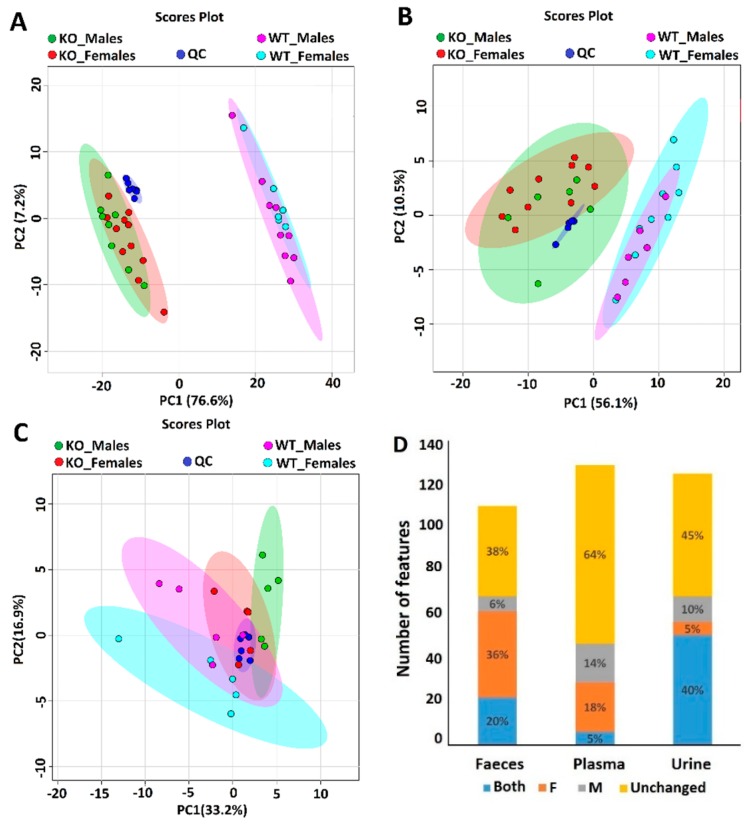
Principal component analysis of urine (A), faeces (B), and plasma (C) metabolome in SLC6A19ko and SLC6A19wt mice. Red data points represent ko females, green data points represent ko males, dark blue data points show quality control (QC) samples, light blue data points show wt females and pink data points wt males. Principal component analysis (PCA) separates the samples by genotype in urine (A) and faeces (B), but not in plasma (C). (D) Stack plot showing metabolic features that have different abundance in wt and ko mice regardless of gender as indicated by blue. Metabolic features that are unchanged are shown in yellow. Features only showing differences between wt and ko females are shown in orange, those that are different in males only are shown in grey. The y-axis shows the total number of metabolic features found in the samples.

