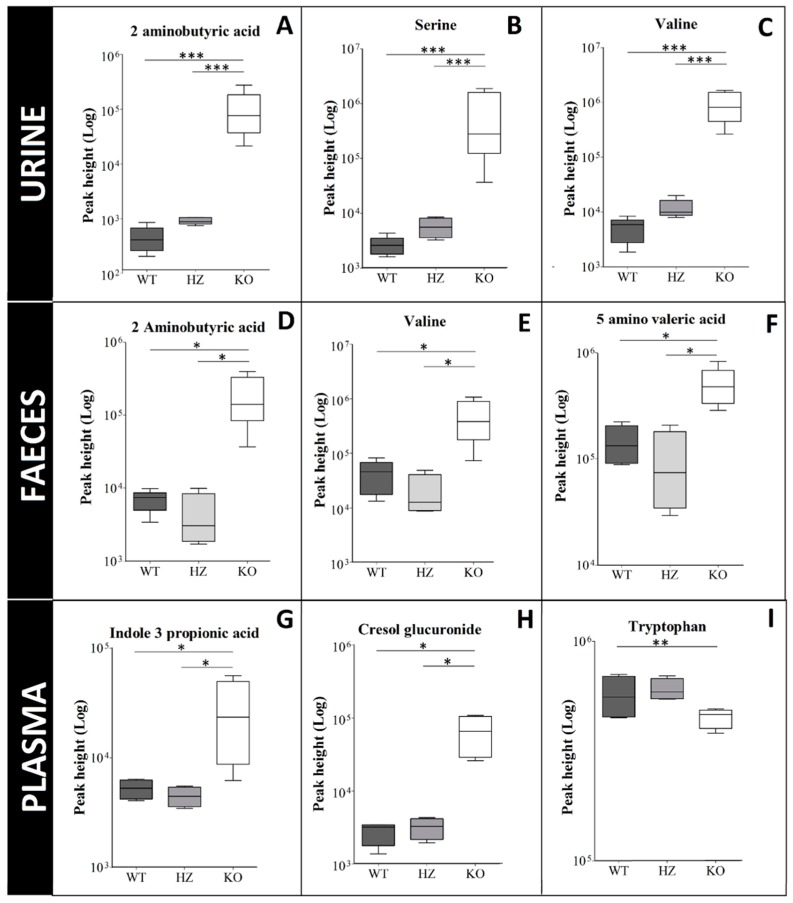
Figure 5.
Correlation between SLC6A19 expression and biomarker levels. Box plots of individual biomarkers in SLC6A19 ko, hz and wt samples. Urine metabolites: (A) 2-aminobutyric acid, (B) serine, (C) valine; faecal metabolites: (D) 2-aminobutyric acid, (E) valine, (F) 5-amino valeric acid; plasma samples: (G) indole-3-propionic acid, (H) cresol glucuronide, (I) tryptophan. Horizontal lines represent from bottom to top: the minimum, 25th, 50th, and 75th percentiles and the maximum. Solid line within the boxplot represents median value. Asterisks define the p value; ***: p < 0.001, **: p = 0.001 to 0.01 and *: p = 0.01 to 0.05.

