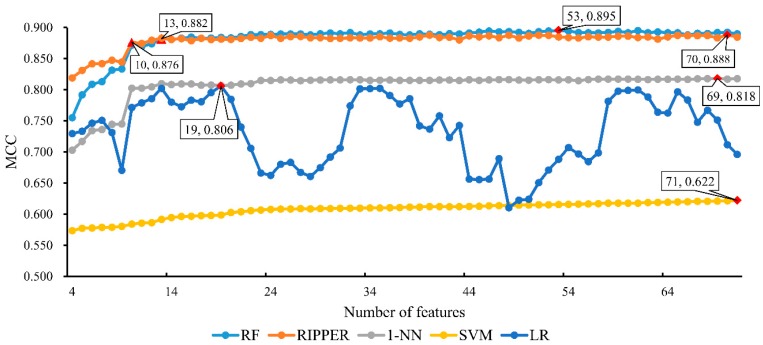
Figure 2.
IFS curves based on the predicted results yielded by the IFS method with five different classification algorithms. The X-axis represents the number of features participating in the classification, and the Y-axis represents the Matthew’s correlation coefficients (MCCs). The optimal MCC (marked with red diamonds) for random forest (RF), repeated incremental pruning to produce error reduction (RIPPER), nearest neighbor algorithm (1-NN), support vector machine (SVM) and logistic regression (LR) is 0.895, 0.888, 0.818, 0.622 and 0.806, respectively. For RF, when top 13 features were used, the MCC value first overcomes 0.880. While for RIPPER, the MCC value first achieves 0.870 when top 10 features were employed.

