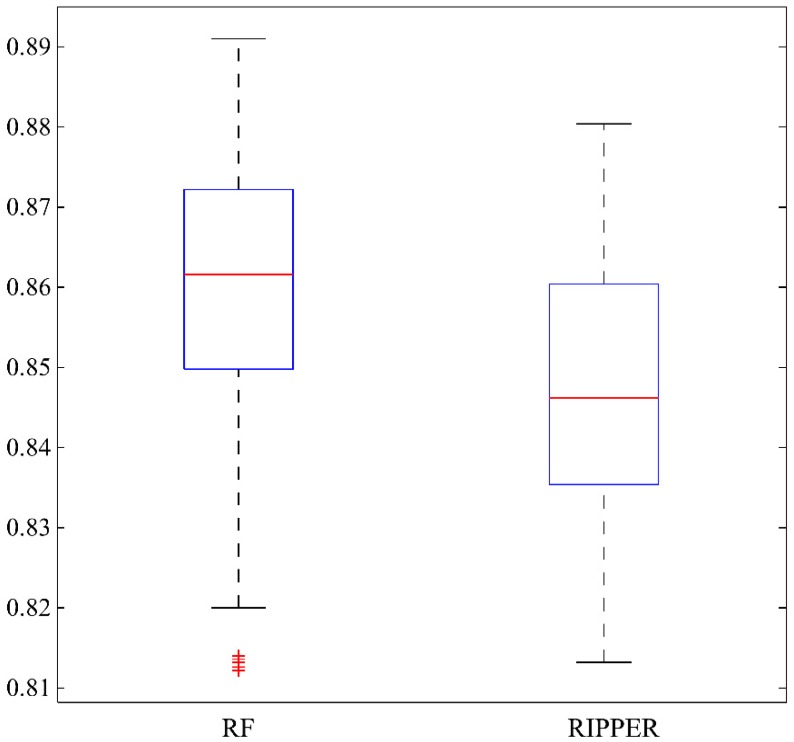
Figure 3.
A box plot to illustrate the performance, measured by Matthew’s correlation coefficient, of random forest (RF) and repeated incremental pruning to produce error reduction (RIPPER) algorithms on 1000 randomly produced feature subsets. For RF, each feature subset contained the feature of expression specificity and 12 other features randomly selected from rest 70 features, while for RIPPER, each feature subset contained the feature of expression specificity and 9 other features randomly selected from rest 70 features.

