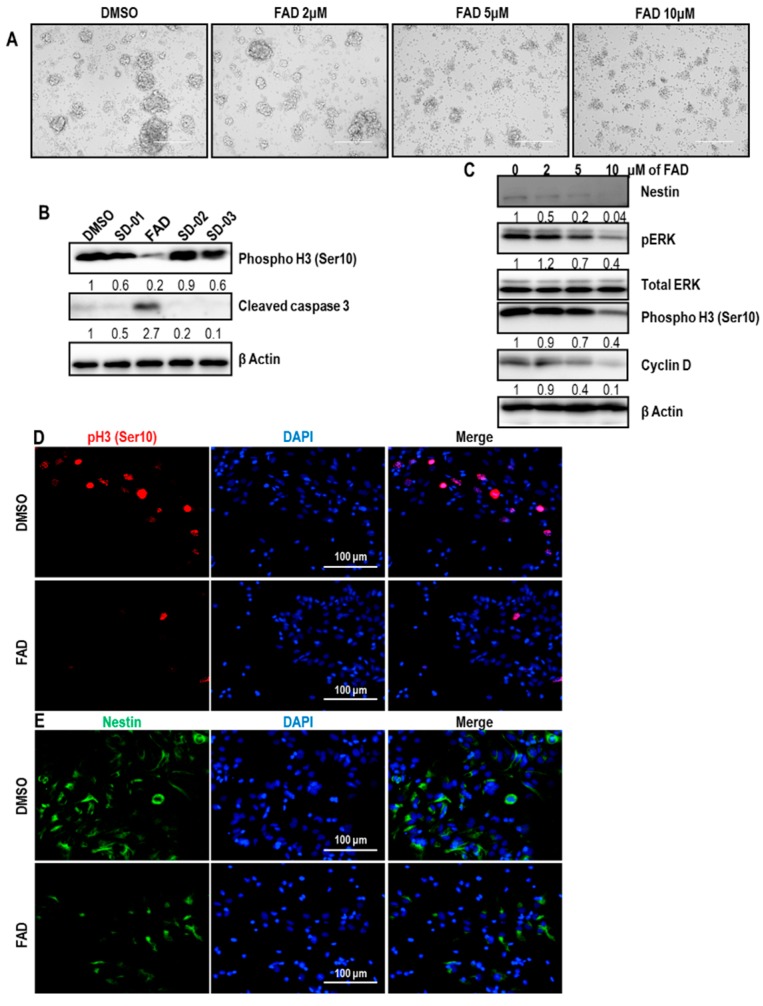
Figure 3.
Disruption of the cellular maintenance by FAD in normal neural stem cells (NSC)s. (A) Sphere-forming capacity of NSCs in the absence (DMSO) or at various concentrations of FAD. Scale bar = 100 μm. (B) Western blot analysis of phosphor Histone 3 (Ser 10) and cleaved caspase 3 in normal NSCs after treatment of DMSO, FAD, and other single compounds (10 μM) for 3 days. β Actin was used as a loading control. The relative band intensities of each proteins are shown below the bands. The intensities of vehicle treated lane were arbitrarily set as 1. (C) Western blot analysis of Nestin, phosphor ERK, total ERK, phosphor Histone 3 (Ser 10), Cyclin D in DMSO or FAD-treated cells. Total ERK was used as a loading control for phosphor ERK. In other cases, β Actin was used as a loading control. The relative band intensities of each proteins are shown below the bands. The intensities of vehicle treated lane were arbitrarily set as 1. (D,E) Immunofluorescence analysis of phosphor Histone 3 at Ser 10 (shown in red) (D) and Nestin (shown in green) (E) expression in DMSO or FAD treated cells. Nuclear DAPI (4′,6-diamidino-2-phenylindole) staining is in blue. Cells were maintained under N2+GF media. These are representative results of counting 10 random fields of view in each group.

