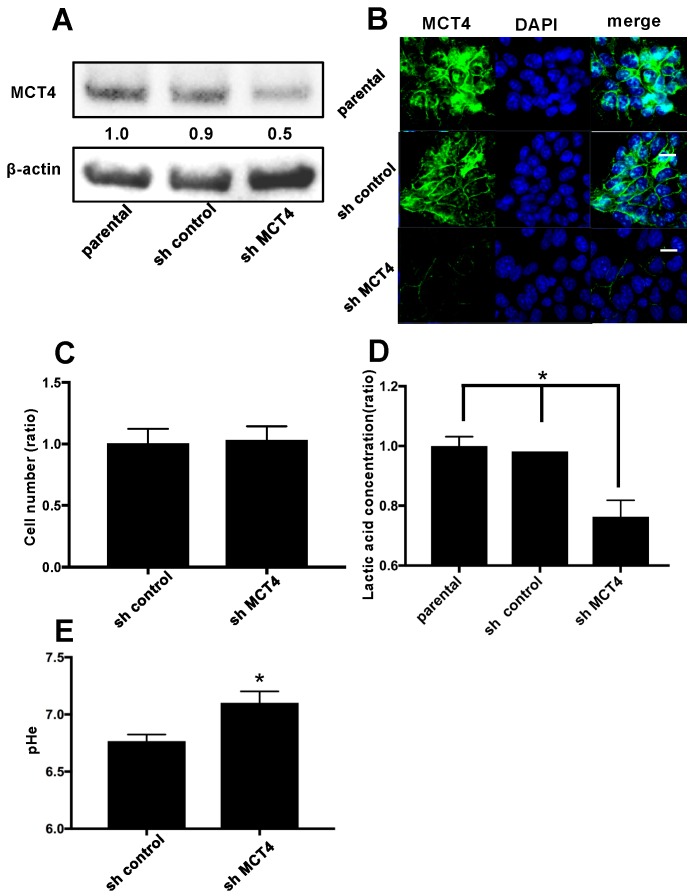
Figure 2.
Reduction of MCT4 protein in HNSCC SAS cells. (A) The expression of MCT4 in SAS cells. After the stable transfection of SAS cells with control shRNA (sh-control) and MCT4 shRNA (sh-MCT4), the transfected and non-transfected cells (parental) were analyzed by western blotting. The expression of MCT4 in sh-MCT4 analyzed with image blot density was approximately one-half that of the parental cells. (B) Immunofluorescence analysis of MCT4 and 4′,6-diamidino-2-phenylindole (DAPI) for nuclear staining in the cells. Left, MCT4 (green); middle, DAPI (blue); right, merge. Sections were incubated with rabbit anti-MCT4 (1:100), then with Alexa Fluor 488 anti-rabbit IgG (1:1000) and encapsulated with DAPI. Scale Bar = 100 μm. (C) Proliferation assay. We cultured sh-control and sh-MCT4 cells for seven days and then counted the number of each (n = 3). There was no significant difference between the cells. Error bars: mean ± SD. (D) Each group of SAS cells was cultured for 24 h. The conditioned medium was then collected and the concentration of lactic acid was measured (n = 3). Error bars: mean ± SD; * p < 0.01 vs. sh-MCT4. (E) Each group of SAS cells was cultured for 48 h. The conditioned medium was then collected and the extra cellular pH (pHe) was measured (n = 3). Error bars: mean ± SD; * p < 0.01 vs. sh-MCT4.

