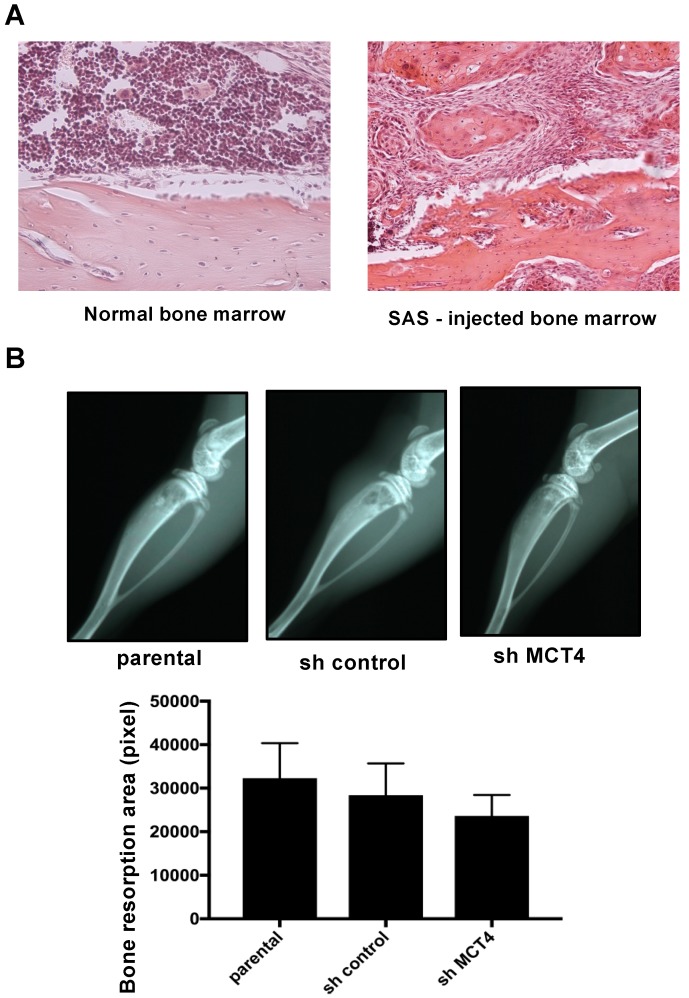
Figure 4.
Bone resorption of the tibia in SAS cell-injected mice. (A) Normal bone marrow tissue and SAS cells colonized in bone marrow (hematoxylin and eosin) at 100× magnification. (B) X-ray photographs showing bone resorptions of the tibia at post-operative day (POD) seven in SAS cell-injected mice. The lower panel compares the bone resorption areas. There was no significant difference between the parental and sh-MCT4 groups (n = 5). Error bars: mean ± SD.

