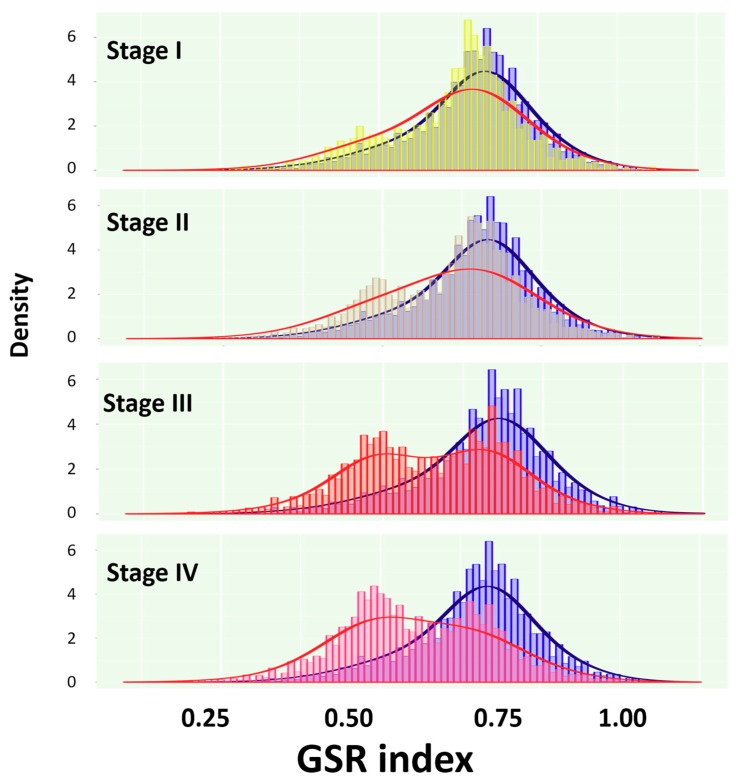
Figure 2.
Histograms of the GSR indices for the immunofunctionomes of stage I to IV and control groups. The figures show two different distributions for the immunofunctionomes from the SC stage I to IV and control groups. The normal ovarian tissue group (blue) located on the right side of the histogram was utilized as the controls for the four SC staging groups. A second peak of distribution was observed and increased in density from stage I to IV, indicating a group of deregulated immunological functions growing in number and increasing in severity as SC progression.

