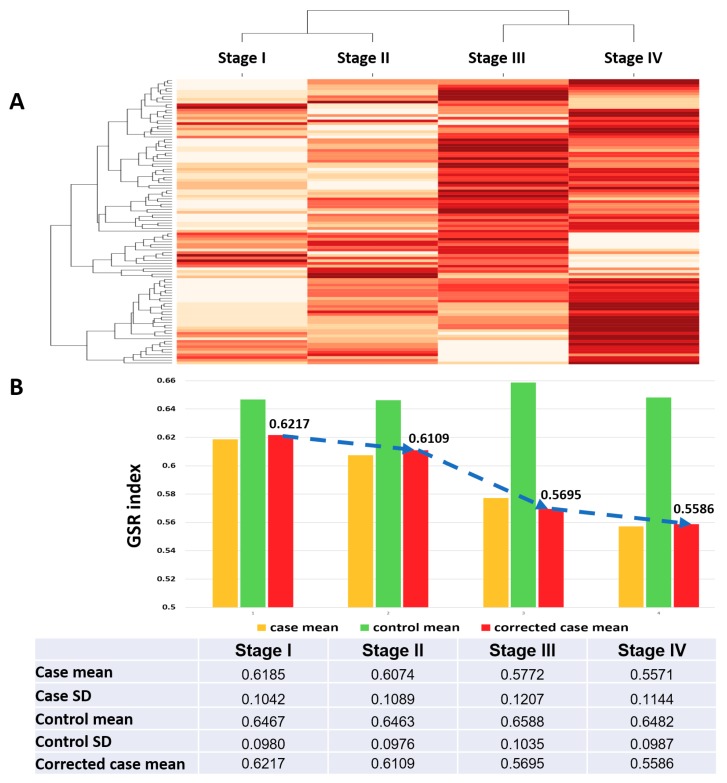
Figure 3.
Dendrogram, heatmaps and the means of GSR indices for the stage I–IV immunofunctionome. (A) The dendrogram (top of the heatmap) shows the relationship among the four immunofunctionomes, which are correctly classified by unsupervised classification. The heatmap showed the deterioration of function regulation from stage I to IV. (B) The values labeling the average of corrected GSR indices for each staging group showed stepwise deterioration from stage I to IV. The mean and SD for the SC samples and controls were listed in the bottom table.

