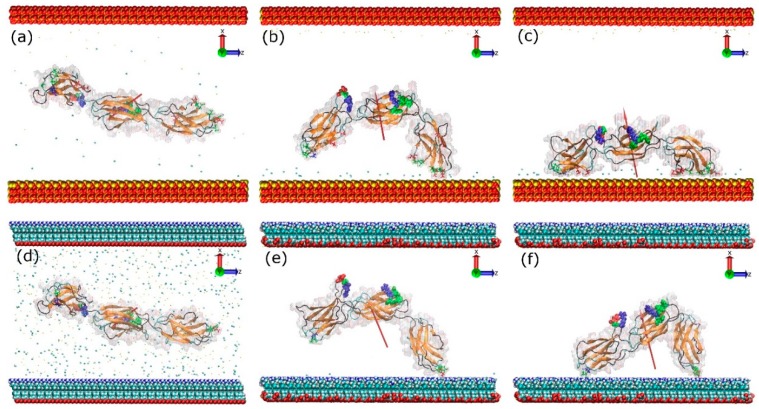
Figure 3.
Adsorption process of FNIII8–10 on the model silica (top) and amine surface (bottom): t = 0 ns (a,d), anchoring event (b,e), end of simulation (c,f). The red arrows indicate the dipole moment of the protein, while the colour-coding is the same as that used in Figure 1. The water molecules are not shown.

