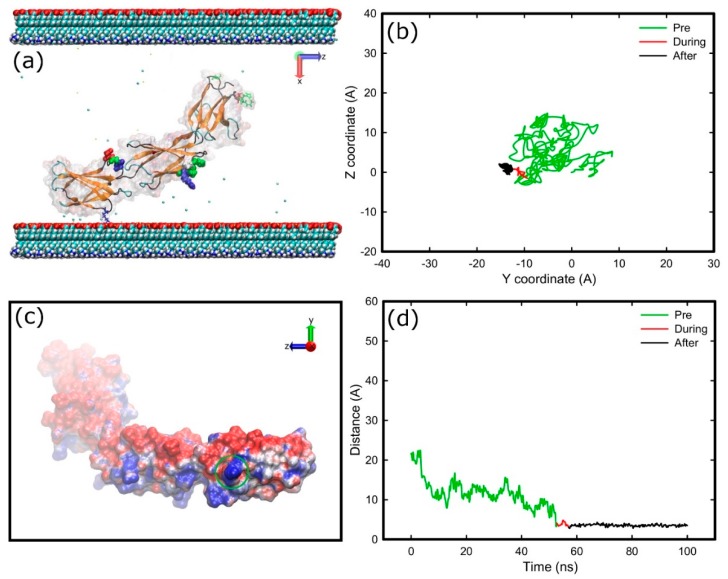
Figure 5.
Adsorption of FNIII8–10 onto carboxyl surface; (a) snapshot at the end of simulation, (b) diffusion of the anchoring residue over the surface, (c) electrostatic representations (APBS) of the FNIII8–10 fragment as viewed from the carboxyl surface on the final stage of adsorption, and (d) distance of the anchoring residue perpendicular to the surface over time. The areas inside the green circles indicate the areas that are in contact with the surface. The deep cueing option of VMD is being used to indicate the distance of each atom from the surface. The colour-coding is the same as previously, while surface atoms and water molecules are not shown for sake of clarity.

