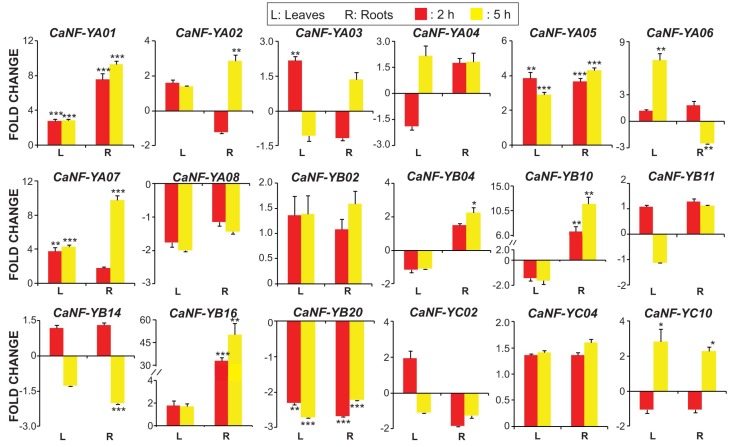
Figure 5.
Quantitative expression analysis of the 18 phylogenetically predicted CaNF-Y genes in leaves and roots of chickpea plants subjected to abscisic acid (ABA) treatment. Red and yellow columns indicate the fold changes of the CaNF-Y genes after 2 and 5 h of ABA treatment, respectively. Error bars indicate the standard errors of three biological replicates (n = 3). Statistically significant differences (Student’s t-test) are shown by asterisks with * p < 0.05, ** p < 0.01, and *** p < 0.001.

