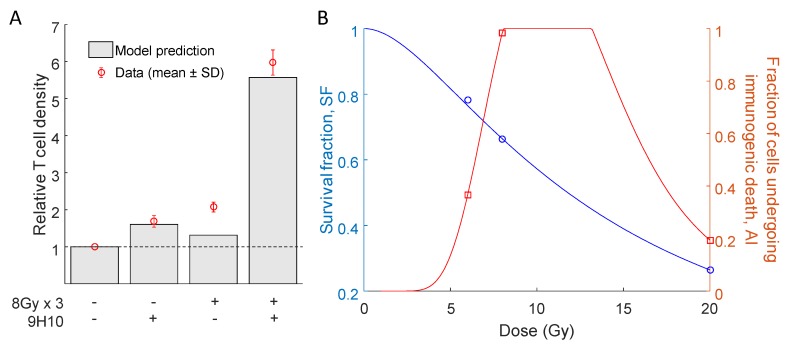
Figure 3.
Comparison of relative T cell density and radiation response curves. (A) Model simulated and experimentally measured changes in immune cell infiltration at the secondary tumor site after the combination of radiotherapy and 9H10 immunotherapy. (B) Proposed interpolation of the model estimated radiation survival fraction () and proportion of cells undergoing immunogenic cell death () for radiation doses D = 6, 8 and 20 Gy (see Table 1) using Equations (1) and (2).

