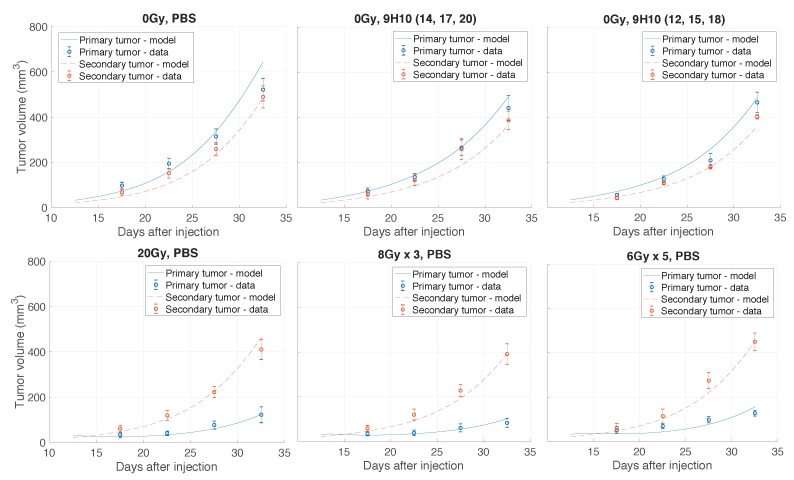
Figure A1.
Comparison of model simulated growth dynamics with experimental data. Solutions to the proposed model (lines; Equations (3)–(10)) were obtained after performing data fitting (estimated parameters are presented in Table 1). Shown are experimental and simulated tumor volumes for tumors grown without treatment or after monotherapy. Experimental data (circles) derived from Dewan et al. [11].

