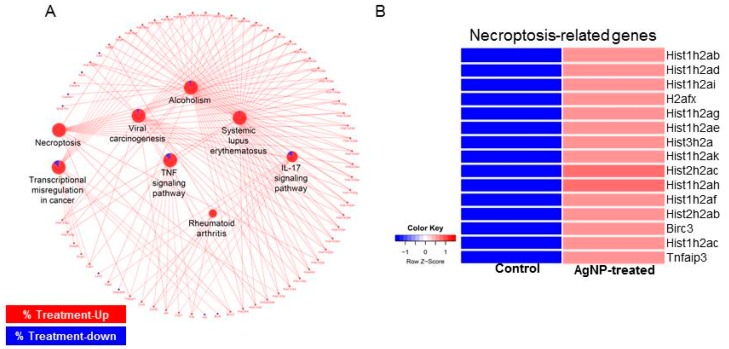
Figure 13.
Biological pathways associated cell death are activated by AgNP treatment. (A) Network analysis showing aberrantly activated pathways in AgNP-treated NIH3T3 cells. Red and blue in the pie chart of pathway represent the ratio of up- and downregulated genes, respectively. (B) Heatmap showing expression level of genes classified in necroptosis pathway.

