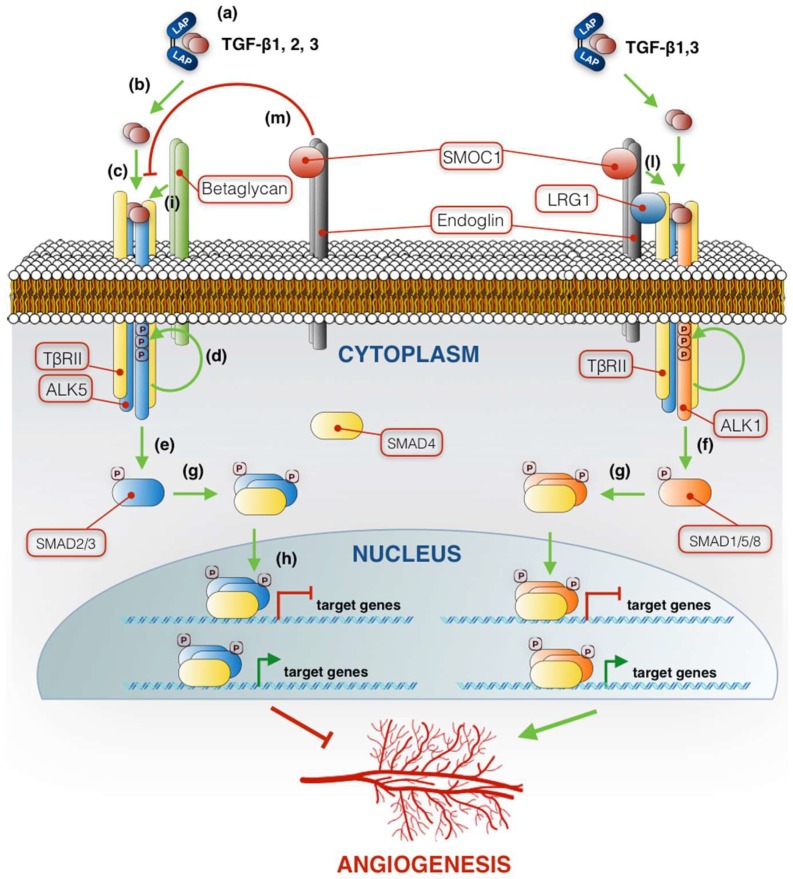
Figure 1.
Schematic representation summarizing the transforming growth factors-beta (TGF-β) receptor complexes and signaling pathway in endothelial cells. The green arrowhead lines represent positive crosstalk interactions and steps. Red flat-ended lines indicate inhibition. In the nucleus, the green arrowhead and red flat-ended lines on the DNA represent activation and inhibition of gene expression, respectively. (a) LAP-TGF-β latent complex. (b) Release of TGF-β from the complex with LAP. (c) TGF-β binding to the heterotetrameric receptor complex. (d) TβRII phosphorylation of type I receptor ALK5. (e) SMAD2/3 phosphorylation by ALK5. (f) SMAD1/5/8 phosphorylation by ALK1. (g) Dimerization of R-SMADs with SMAD4. (h) Translocation of the R-SMAD/SMAD4 complex into the nucleus and binding to regulatory sequences. See text for details.

