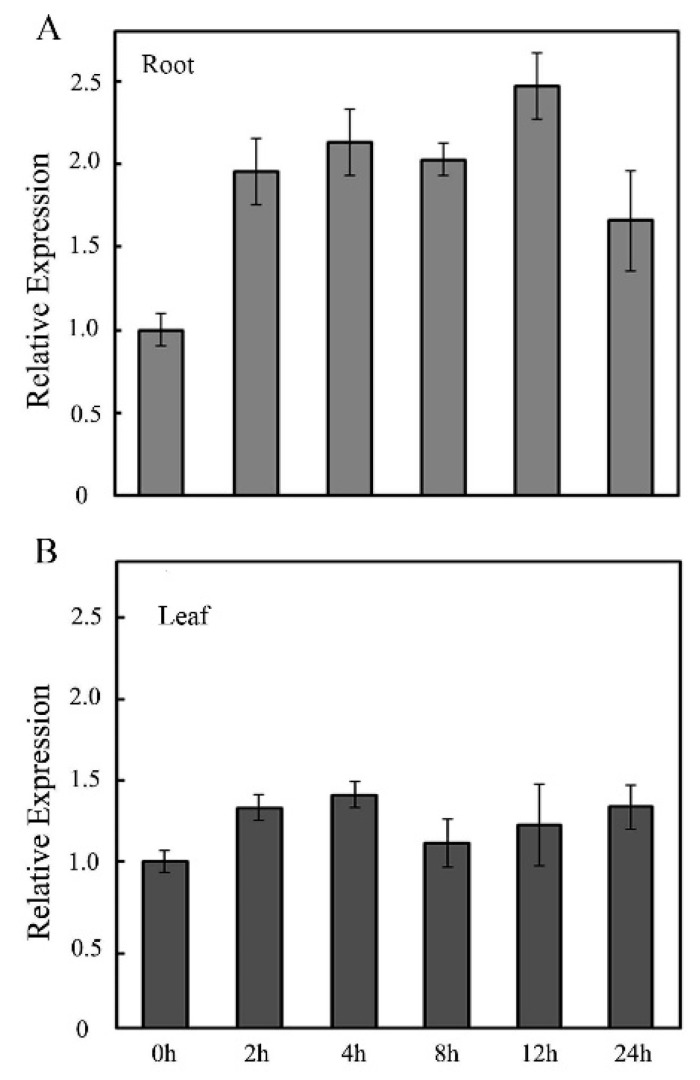
Figure 1.
Salt induces OsVTC1-3 expression in root. (A) The expression patterns of OsVTC1-3 in rice roots under salt treatment were analyzed by qPCR. (B) The expression patterns of OsVTC1-3 in rice leaves under salt treatment were analyzed by qPCR. After normalizing to internal control Actin, the transcript level of OsVTC1-3 under control conditions (0 h) was assigned as “1”, and this figure shows the expression level of OsVTC1-3 at other time point relative to 0 h. The experiments were repeated three times. The bars represent the SE (±) of three independent assays.

