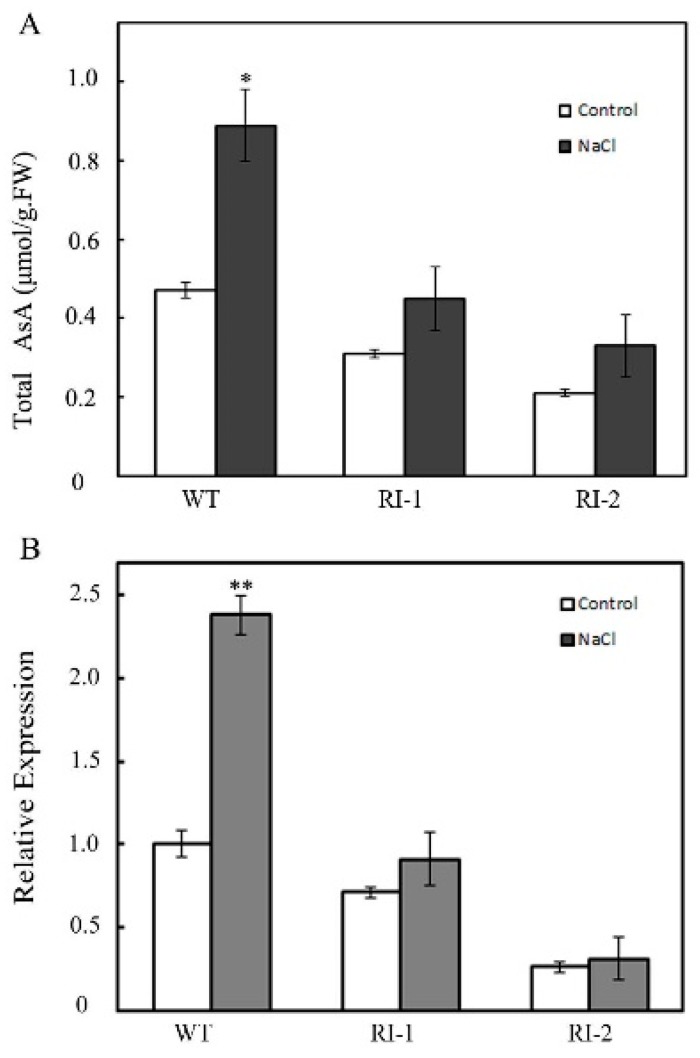
Figure 5.
OsVTC1-3 regulates AsA synthesis in rice root under salt stress. (A) The transcript level of OsVTC1-3 in WT and OsVTC1-3 RI plants under salt stress. Control indicates that plants were grown under normal conditions, and NaCl indicates that plants were treated with 150 mM NaCl for 12 h. (B) The AsA content of OsVTC1-3 RI plants under salt stress. Control indicates that plants were grown under normal conditions, and NaCl indicates that plants were treated with 150 mM NaCl for five days. The bars represent SE (±) of three independent assays, and the asterisk indicates results significantly different from that of the normal condition (** p < 0.01 and * p < 0.05). Significance was evaluated by the t-test.

