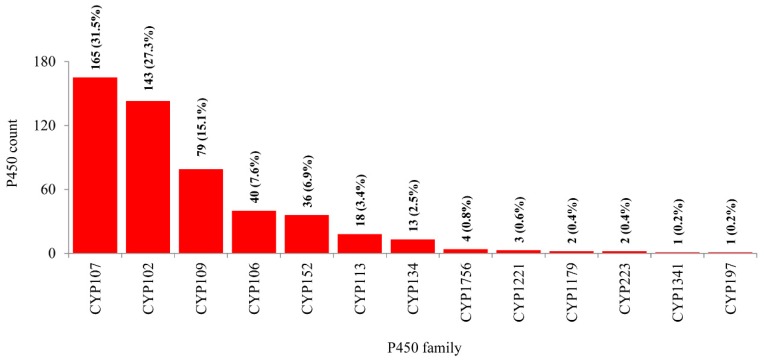
Figure 3.
Comparative analysis of P450 families in Bacillus species. The numbers next to the family bar indicate the total number of P450s and percentage contribution (parenthesis) by a respective family to the total number of P450s. The data on the number of P450s in each P450 family in Bacillus species is presented in Table S1.

