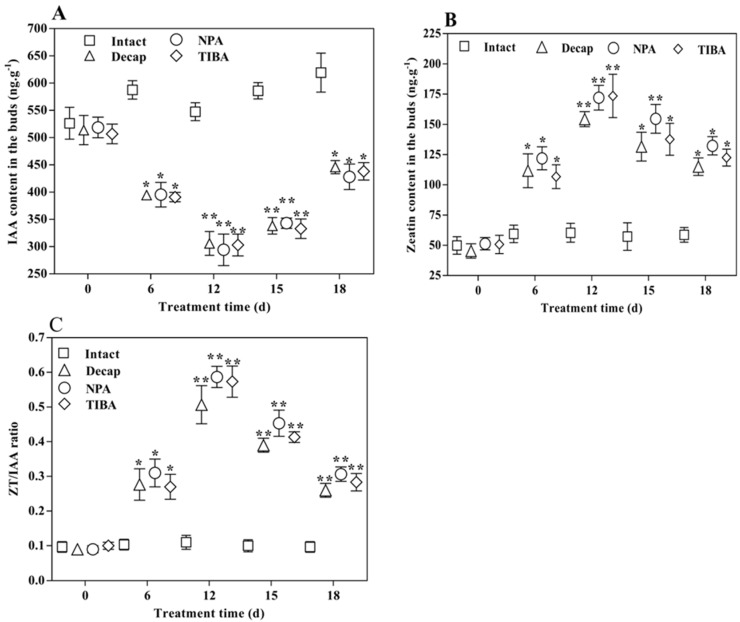
Figure 3.
The phytohormone content of C. appendiculata lateral buds was tested during the bud elongation process by HPLC: (A) IAA; (B) zeatin; and (C) zeatin/IAA ratio. Values are means ± SD, n = 3. Error bars indicate the standard deviations obtained from three biological replicates. * and ** indicate significant differences based on one-way ANOVA tests at p < 0.05 and p < 0.01, respectively, compared with the intact group.

