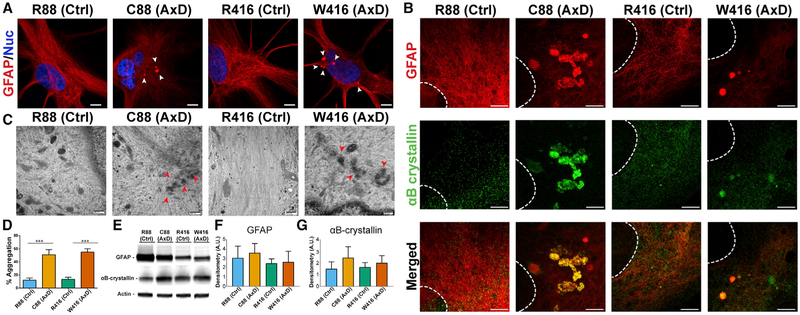
Figure 2. GFAP Expression and Aggregation in Differentiated Astrocytes.
(A) Immunocytochemistry for GFAP showing perinuclear GFAP+ puncta (arrowheads). Scale bar, 10 μm.
(B) STED microscopy images on astrocytes stained for GFAP (red) and αB-crystallin (green). Scale bar, 2 μm.
(C) Electron micrographs of aggregated GFAP (arrowheads). Scale bar, 800 nm.
(D) Quantification of cells exhibiting punctate GFAP signal over total GFAP population (n = 4).
(E) Western blot from 6 month astrocyte lysates probed for GFAP, xαB-crystallin, and actin.
(F) Densitometry analysis for GFAP (n = 3).
(G) Densitometry analysis for αB-crystallin (n = 3).
*p ≤ 0.05. Data are represented as mean ± SD.

