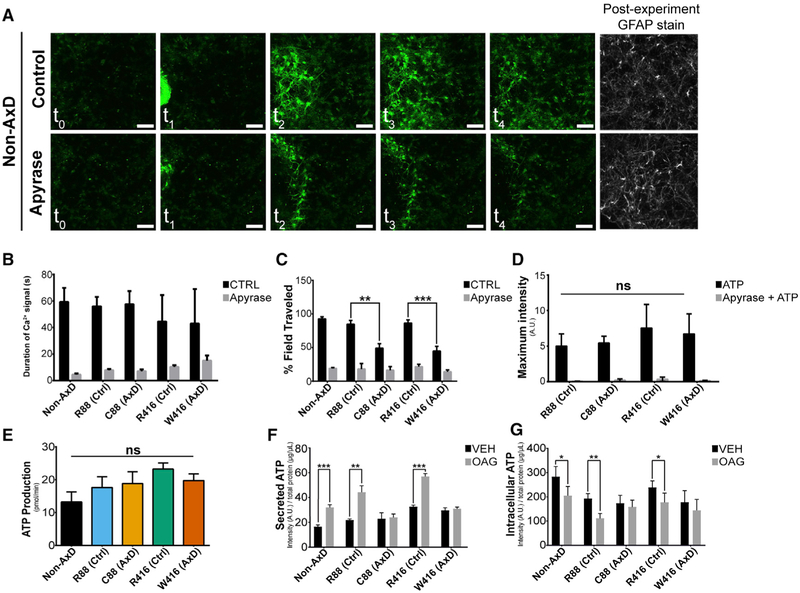
Figure 6. ATP Secretion Deficits in AxD Astrocytes.
(A) Still images over the duration (2 min) of mechanical stimulation on wild-type 6 month astrocytes ± apyrase with accompanying post-experiment GFAP stains.
(B) Average duration of increased calcium signal above threshold ± apyrase (n = 10).
(C) Average percentage of field traveled by Ca2+ wave ± apyrase (n = 10).
(D) Maximum fluorescence intensity achieved after bath application of 100 μm ATP ± apyrase (n = 10).
(E) Average results of ATP production via seahorse metabolic profiling (n = 3).
(F) Average ATP concentration detected in media ± OAG treatment (n = 3).
(G) Average ATP concentration remaining in cells ± OAG treatment (n = 3).
**p = 0.001–0.01 and ***p < 0.001. Scale bars, 100 μm. Data are represented as ± SEM.

