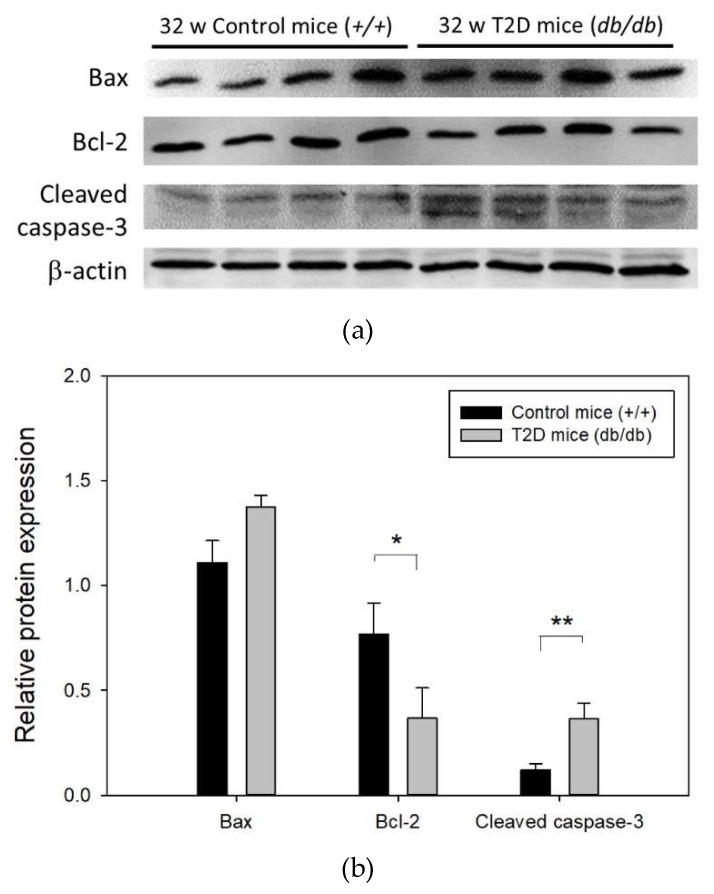
Figure 5.
(a) Representative western blot image of apoptosis related protein expression in T2D and control mouse retina (b) Results of Bax, Bcl-2, and cleaved caspase-3 expression in mouse retina normalized to that of the internal control, β-actin. Data are presented as mean ± SD. * p = 0.008, ** p = 0.025 (t-test). w: weeks.

