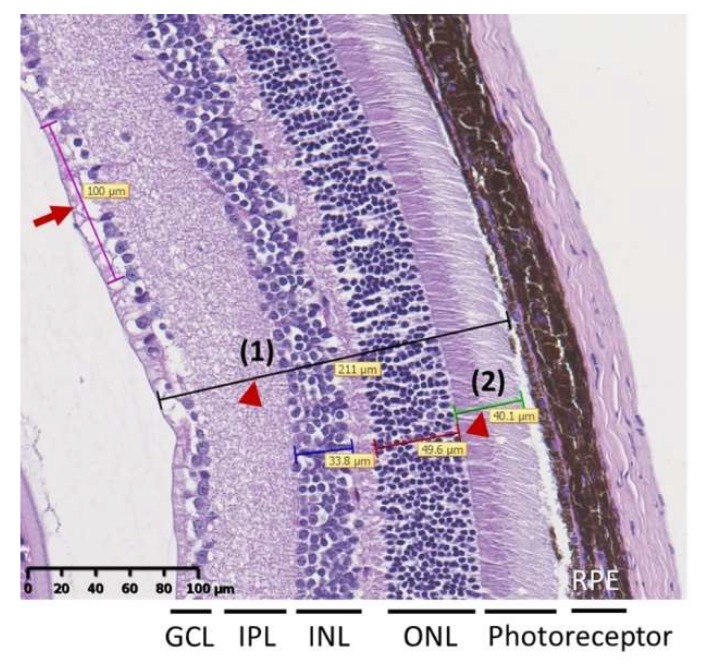
Figure 6.
Representative image of retina for measurement of total retina thickness [indicated by arrow head (1)] and thickness of photoreceptor layer [(indicated by arrow head (2)]. Cell number per 100 μm of the GCL was counted based on the linear cell density (arrow). Data were presented as mean ± SD and were measured three times in each hemisphere.

