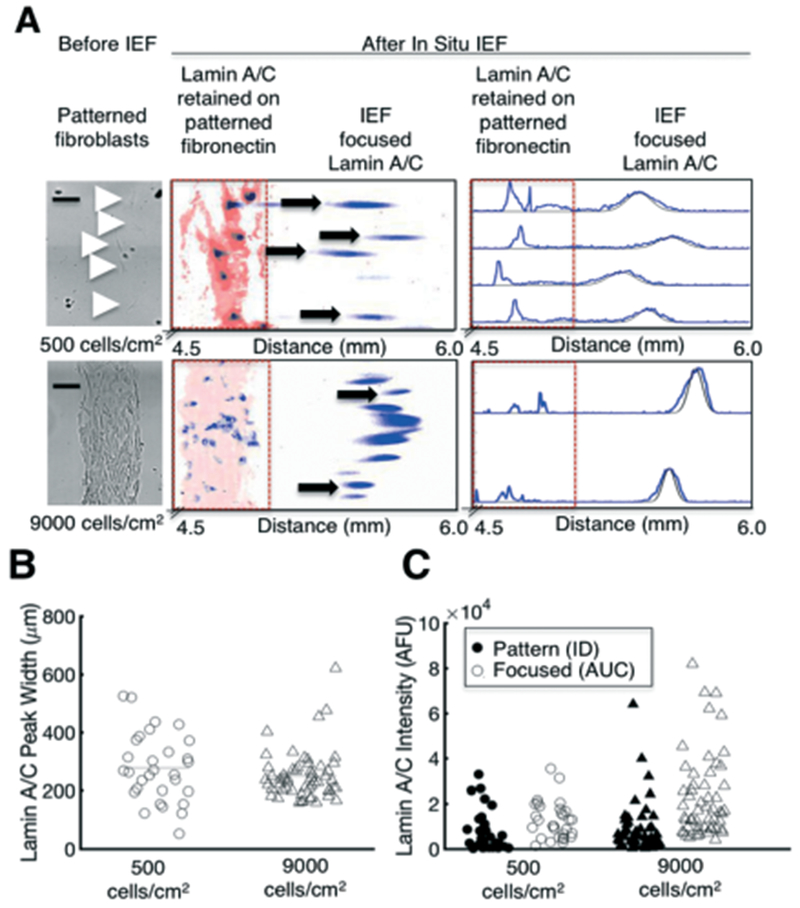
Fig. 3.

In situ IEF separates and detects proteins from single and clustered cells. (A) Brightfield images of single cells and a ~80% confluent pattern of cells prior to in situ IEF (left), and false-colour inverted fluorescence micrographs of lamin A/C that is retained on the fibronectin pattern and focused into a Gaussian peak (middle). The protein peaks are segmented and fluorescence intensity profiles are generated for each peak (right). Black line indicates Gaussian fit. (B) Separation performance, as measured by lamin A/C peak width, does not significantly change with higher seeding density, indicating that protein is not overloaded. (C) Protein mass measurements of lamin A/C that is retained on the fibronectin pattern (ID) and focused (AUC). Bars represent the mean. Scalebars, 200 μm. AFU, arbitrary fluorescence units. ID, integrated density. AUC, area under curve. pI, isoelectric point.
