Fig. 5.

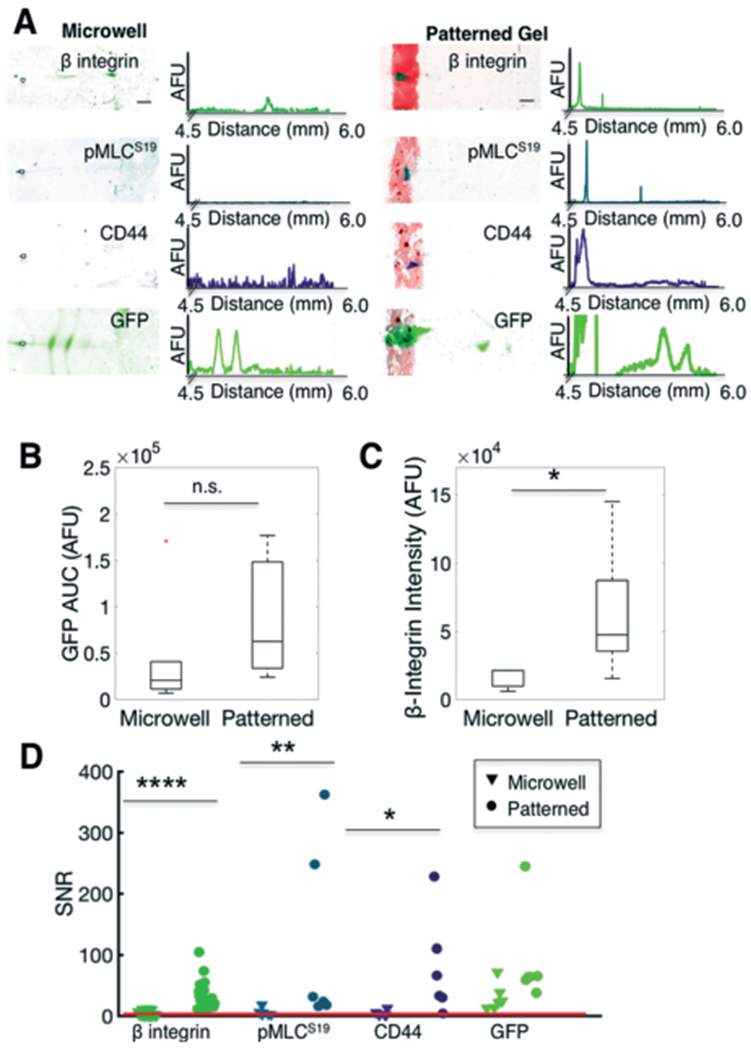
In situ IEF of adherent cells assays protein profiles that differ from trypsin-treated (detached) cells. (A) False-colour inverted fluorescence micrographs and intensity profiles of IEF of single cells detached using trypsin and seated into microwells (left) or analysed via in situ IEF of fibronectin-patterned (attached) cells (right). (B) Box plot of GFP control protein content (AUC) of focused peaks indicates comparable expression between microwells and fibronectin-patterned cells. Line in the box represents the median and box ends represent the 25th and 75th percentiles. Red dots indicate outliers. (C) Box plot of β-integrin indicates higher expression in patterned cells. (D) Comparison of measured SNR of various targets. Compared to microwell IEF, in situ (adhered cells on fibronectin pattern) IEF results in higher SNR of β-integrin, pMLCS19, and CD44, targets that are adversely affected by trypsin treatment. The red line indicates SNR threshold of 3. Scalebars, 200 μm. AUC, area under curve. SNR, signal-to-noise ratio. AFU, arbitrary fluorescence units. * p < 0.05, ** p < 0.01, **** p < 0.0001.
