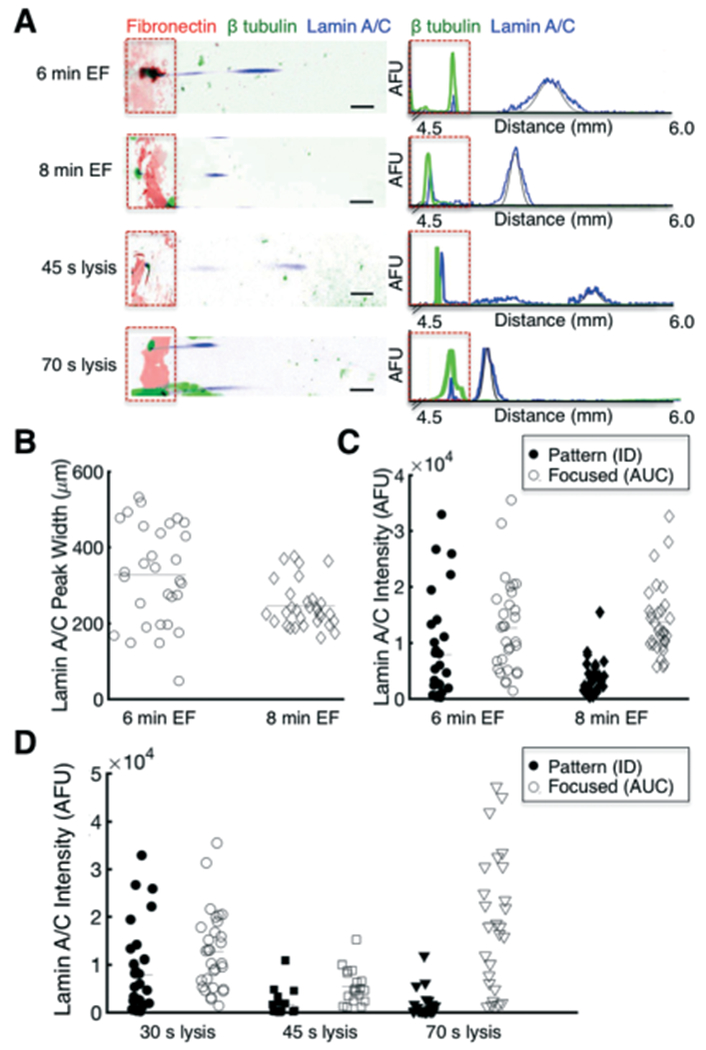
Fig. 6.

Separation performance, as measured by lamin A/C peak width, and protein solubilisation are enhanced by tuning the EF and lysis durations, respectively. (A) False-colour inverted fluorescence micrographs and intensity profiles of single cells lysed for 30 s and electrofocused for 6 min, compared to either a longer EF duration of 8 min, or longer lysis durations of 45 s or 70 s. Contrast adjusted for improved visualisation. Black line indicates Gaussian fit. (B) Analysis of peak width for longer EF duration indicates improved separation performance (lower peak width). Bars represent the mean. (C) Comparison of lamin A/C protein mass retained on the fibronectin pattern or focused to lamin A/C pI as a function of EF duration. (D) Comparison of lamin A/C protein mass retained on the fibronectin pattern or focused to lamin A/C pI as a function of lysis duration. The longest lysis duration (70 s) improved lamin A/C solubilisation, as evidenced by higher focused protein content. Data from 30 s lysis duration are the same as the 6 min EF duration. Scalebars, 200 μm. AFU, arbitrary fluorescence units. ID, integrated density. AUC, area under curve. EF, electrofocusing.
