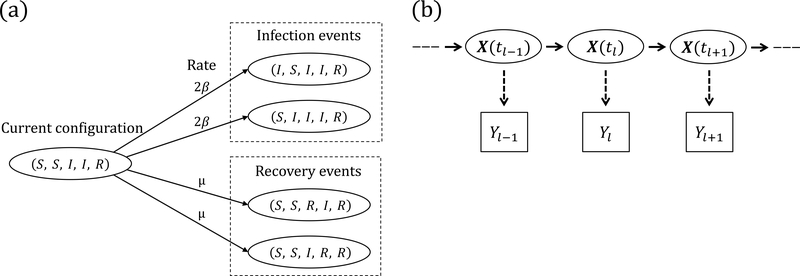
Figure 1:
(a) SIR dynamics in a population of five subjects. The number of infecteds can increase from two to three via an infection of the first or second subject, reaching each of those configurations at rate 2β. The number of recovered individuals can increase from one to two via a recovery of the third or fourth subject, reaching each of those configurations at rate μ. (b) Hidden Markov model for the joint distribution of the latent epidemic process and the data. The observations, Yℓ, ℓ = 1,…,L, are conditionally independent given X(t), and , ρ ∼ Binomial(, ρ).

